
The Leaning Tower of Pisa is regarded as one of the most famous landmarks in the world, although geotechnical engineers probably view it more as a construction gaffe. To prevent such a leaning fate, it could be useful to run an analysis in order to predict possible subsidence due to poroelastic deformation.
Leaning Tower of Pisa
The ground underneath and neighboring a structure directly affects its structural integrity. When construction for the Leaning Tower of Pisa began in 1173, they used foundation materials of soft ground, sand, and clay. Not the best soil recipe for an eight-story monument to be built on top of, and definitely one that would have been red-flagged in modern times. As we know today, the soil under the building could not fully support the structure’s weight, and it began sinking to one side. An effect we can attribute to poromechanics.
What Are Poromechanics and Poroelasticity?
Poromechanics is the study of porous media, which are filled with fluid. The porous material consists of a network of pores, or voids, spread throughout a solid or matrix. One way to envision this is the stiff equivalent of a sponge soaked in water, much like the blocks of porous ceramic you can see below, except they would be saturated in a fluid.
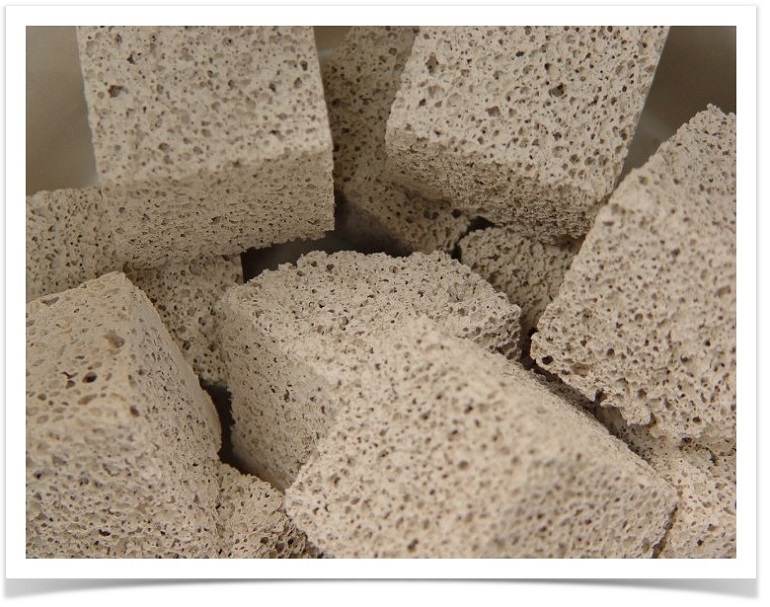
Porous ceramic blocks. Image found on Wikipedia.
When the porous matrix deforms elastically due to external loads or fluid pressure, it is termed a poroelastic material. As a result, the volume fraction of the pore void changes. The more incompressible the fluid in the pores, the stiffer the porous structure. Additionally, squeezing the matrix will induce changes in pore pressure, which, in turn, will induce fluid motion. Biot poroelasticity is used to describe these coupled physics of fluid flow in the pores and elastic deformation of the porous matrix.
When fluid is pumped out of a reservoir, it reduces the pore pressure. Consequently, the equivalent stress on the geological layer (earth) changes, which results in subsidence. Thus, a reservoir provides a real-life example of Biot poroelasticity. You can use the Subsurface Flow Module, an add-on to COMSOL Multiphysics, to simulate this.
Running a Biot Poroelasticity Analysis
You can use the Biot Poroelasticity model, available in our Model Gallery, to analyze the linked fluid flow and solid deformation.
Note that this model is an extension of the Terzaghi Compaction model, which only shows vertical compaction.
The model consists of three sedimentary layers that lie on top of each other and over an impermeable bedrock in a basin. The top-two layers are the same thickness across the model geometry, while the bottom layer is deepest at the centerline (left side) of the basin. The bedrock is faulted on one side, which creates the “step” as shown.
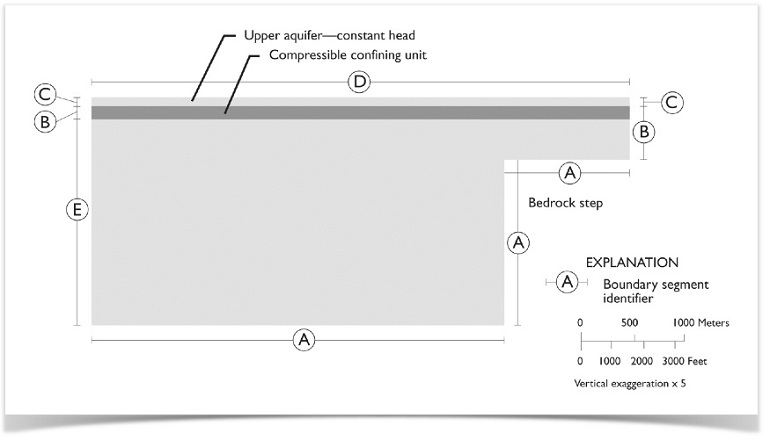
Geometry of the model with boundary segments shown.
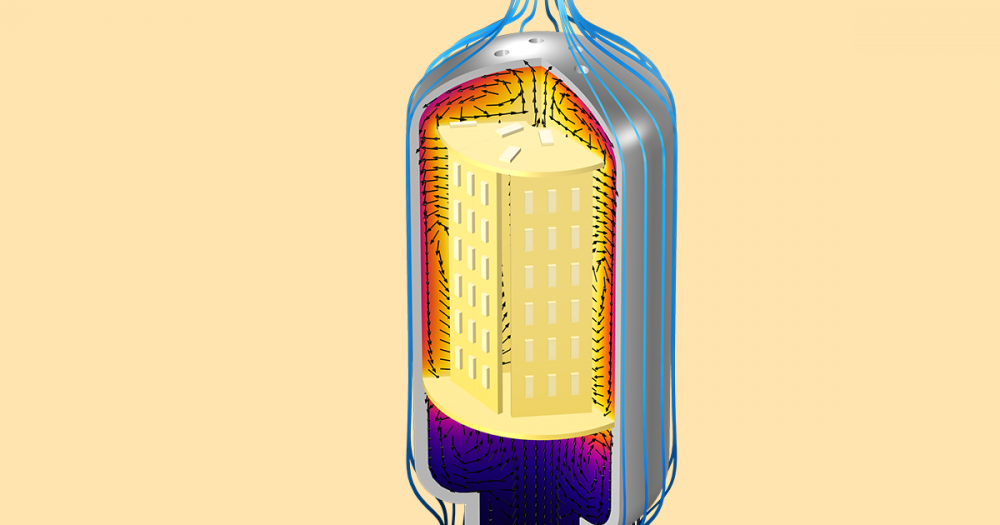
In our simulation, fluid is being pumped from the centerline of the basin, so it flows from left to right. Also, as the water is pumped, it causes fluid to be pulled away from the step. We want to observe the changes in the sedimentary layers at two, five, and ten years, so we use the Poroelasticity interface as well as the Darcy’s Law interface. This allows us to perform a two-way coupled analysis of the fluid flow and solid deformation.
After the model has been solved, we can generate plots showing the total displacement of the sediments for each time period. The plots will show us that because of the reduction in hydraulic head, due to pumping, the layers compensate by stretching laterally. This deformation becomes more prominent over time.
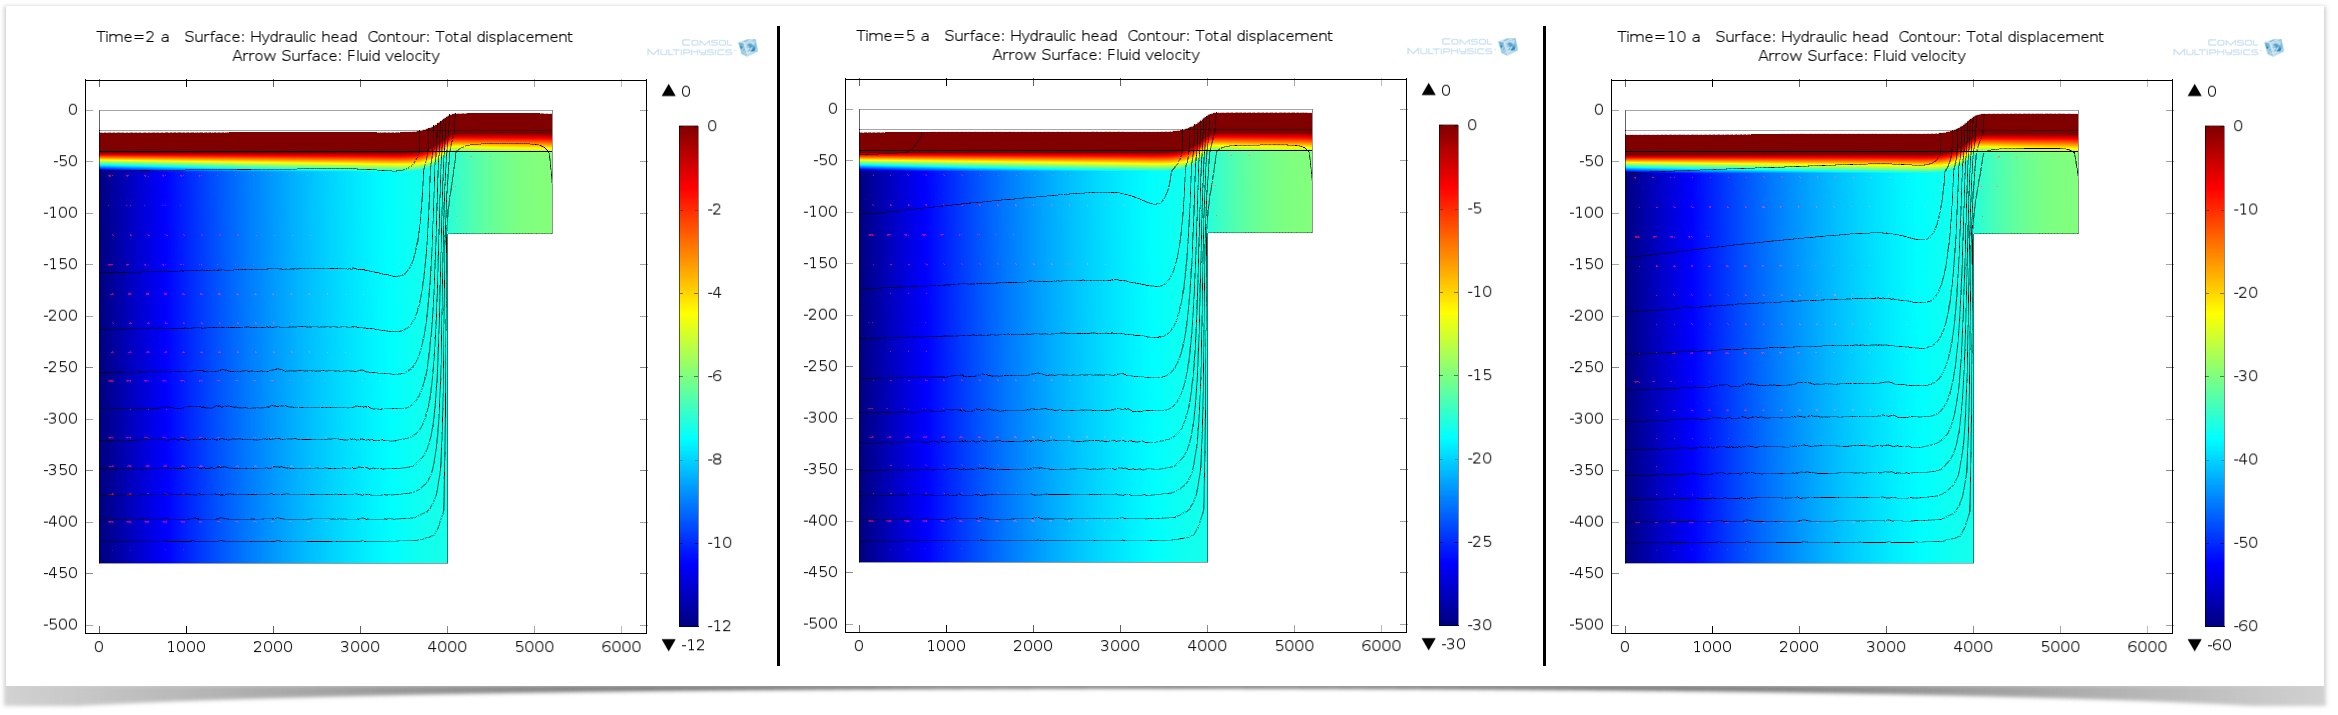
Hydraulic head (surface), total displacement (contours and deformations), and fluid velocity (arrows) of sedimentary layers at two, five, and ten years.
The Biot poroelasticity analysis will further indicate horizontal strain at the surface of the ground. Generating a line graph of the strain tensor shows us the horizontal displacement for the three different time periods:
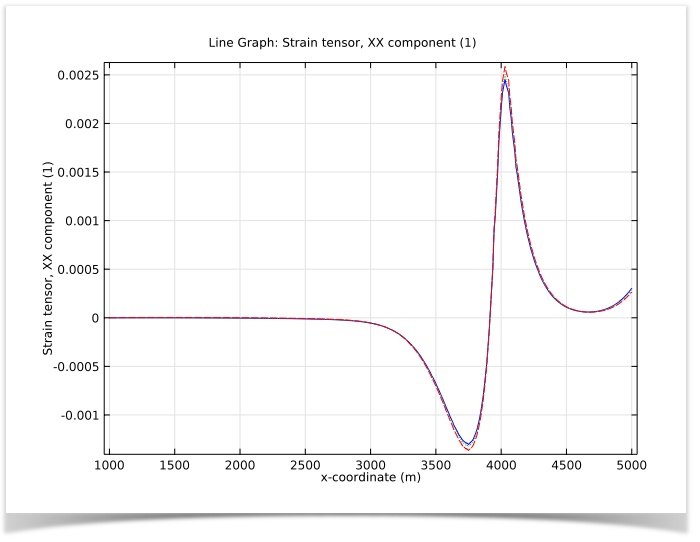
Horizontal strain over time. Year 2 (blue, solid line), Year 5 (green, dotted line), and Year 10 (red, dashed line).
We have now assessed how the porous media deforms as a result of fluid withdrawals using the Biot poroelasticity approach. We know that the basin side of the step experiences compaction (negative strains), while the mountain side experiences tension (positive strains). Running this type of analysis certainly would have been helpful prior to the construction of the Tower of Pisa.


Comments (0)