Learning Center
Getting Started With COMSOL Multiphysics®
Results / Slice Plots
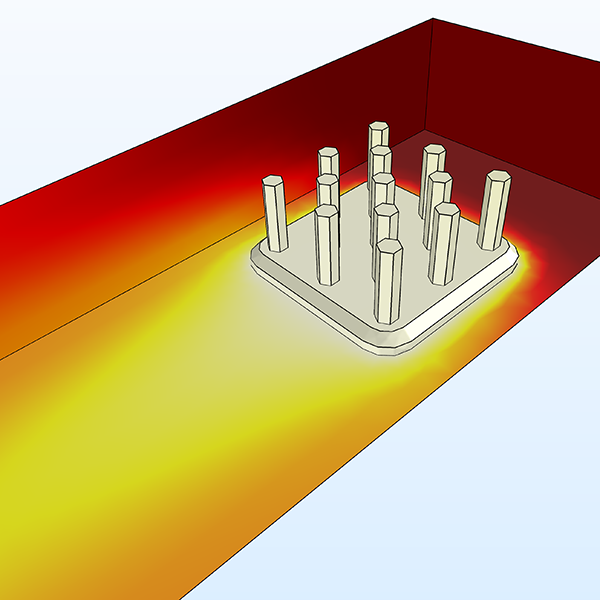
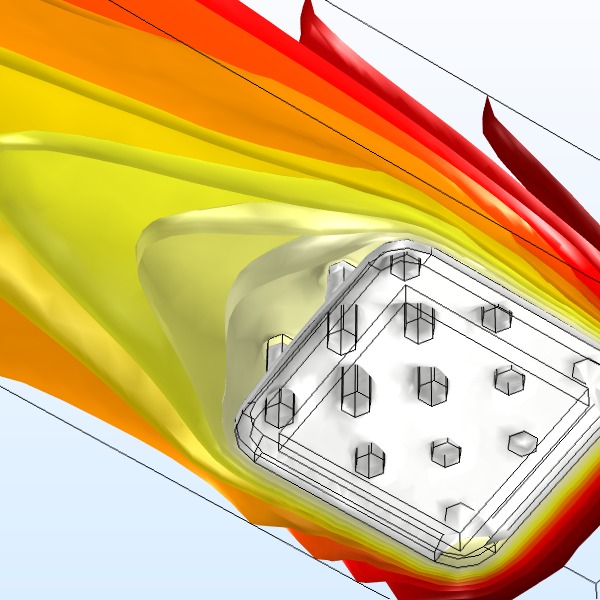
Display results in cross sections. Duration: 6:31Slice plots are a postprocessing tool that can be applied to your COMSOL Multiphysics® simulations that are modeled in 3D. You can use a Slice plot to display a quantity on one or more cross-sectional areas within your 3D domain, usually to visualize the change in a variable throughout the domain.
Watch the video to learn how to use Slice plots to fit the needs of your model. For the heat sink model we demonstrate here, we can add a Slice plot to show the temperature changing with distance from the heat sink, or the velocity of the air changing as it flows through the channel.
Video Playlist
Results
Videos: 7
-
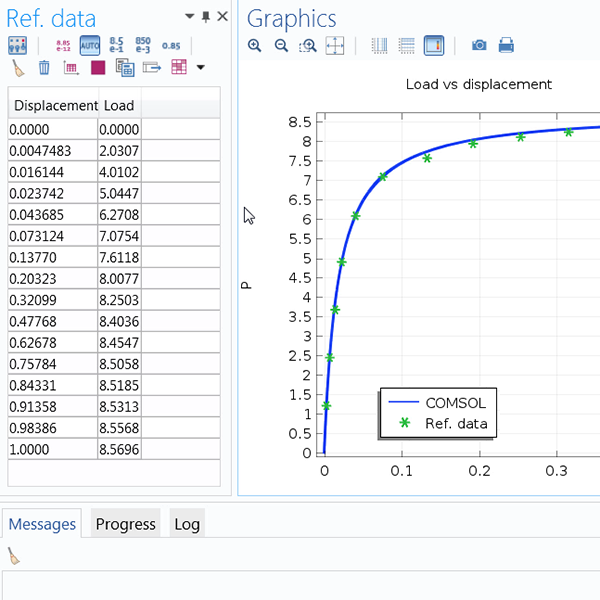
Import Reference Data
Import external data to compare with results.
-
Surface, Volume, Line Plot
Show results on different geometric entity levels.
-
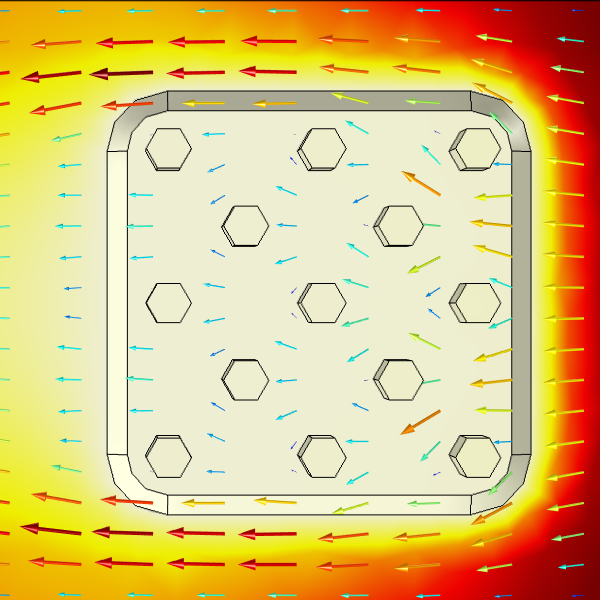
Arrow Plots
Visualize field distributions in your results.
-
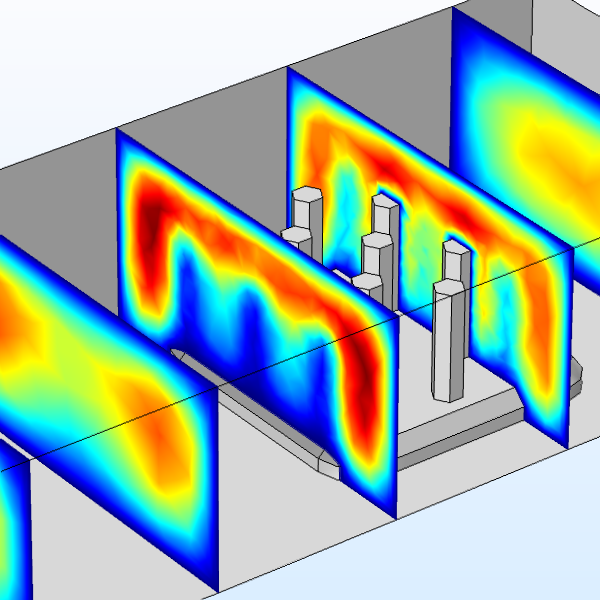
Slice Plots
Display results in cross sections.
-
Contours and Isosurfaces
Show results using colored lines or surfaces.
-
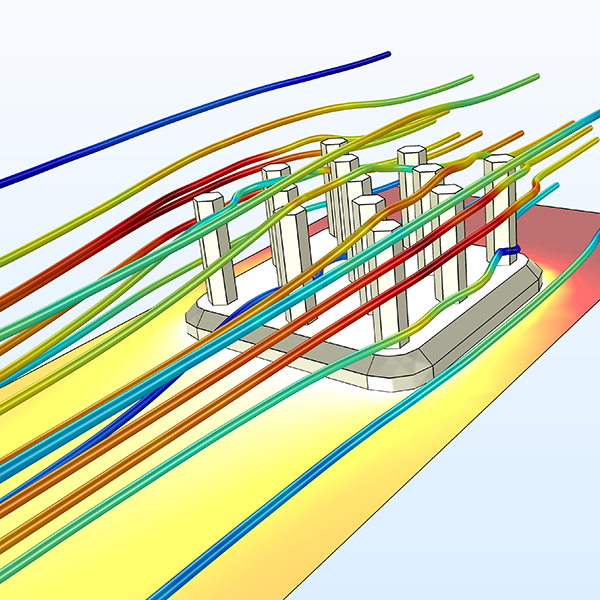
Streamline Plots
Visualize vector quantities in your results.
-
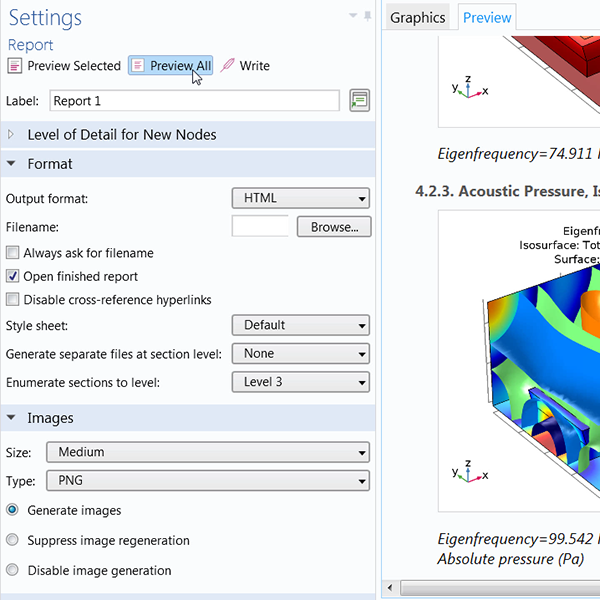
Report Generation
Export reports of your model from the software.
-
Introduction
-
User Interface
-
Geometry
-
Definitions
-
Materials
-
Physics
-
Mesh
-
Study
-
Results
-
Application Builder