

Cars need brakes for obvious reasons, and you don’t want these to fail. Brake failure can be caused by many things, one of which is the overheating of the brake’s disc. As I’ve said before, no engineer wants to design a product that fails, which is also true in the case of brake-disc design. Let’s study a scenario of a car in panic brake mode, and find out how hot the brake discs and pads get as well as how much they cool down in between brake engagements.

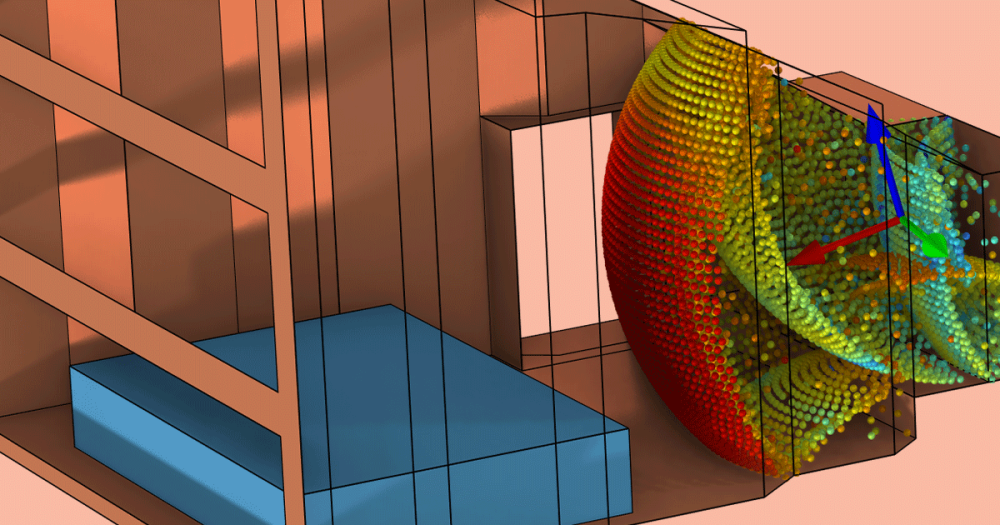
Geometry of a car’s brake disc and pad in 3D. Disc radius is 0.14 m, thickness is 0.013 m.
When Brake Discs Overheat
Let’s suppose an 1,800 kg car is traveling at 25 m/s (90 km/h or about 56 mph), until the driver suddenly panic brakes for 2 seconds. At that point the eight brake pads slow the car down at a rate of 10 m/s2. (We’re assuming the wheels don’t skid against the road). Upon braking for two seconds the driver releases the brake, leaving the car traveling at 5 m/s for eight seconds without engaging the brakes.
When the driver is pressing down on the brakes, kinetic energy is transformed into thermal energy. If the brake discs overheat, the brake pads cease to function through brake fade where the material properties of the brake change due to the temperature overload. This is why it’s so important during the design-stages to simulate the transient heating and convective cooling to figure out what the minimum interval between a series of brake engagements is.
Simulating Transient Heating and Final Temperature of a Brake Disc
If we continue with our scenario as outlined above, we can ask ourselves two questions:
- How hot do the brake discs and pads get when the brake is engaged?
- How much do the discs and pads cool down during the rest that follows the braking?
By using COMSOL Multiphysics and the Heat Transfer Module, we can model the transient heating and final temperature of the car’s disc brake in the given brake-and-release sequence.

|

|
| Surface temperatures of the disc and pad immediately prior to releasing the brake at t=1.8 s. | Plot showing temperature versus time with a radial line. |
As you can see in the figure above to the left, there is a hot spot where the pad and the disc touch (at the brake pad’s edge). This is the area that could overheat to the point of brake failure or fade. Naturally we’d want to examine this further, which is where the right-hand figure comes into play. Plotting the temperature versus time along the line from the center to the edge of the pad is helpful in investigating the hot spot we found. This actually showed a maximum of about 416K occuring after just one second from applying the brakes, and not the two seconds you would intuitively think.

Plot comparing the total produced heat (solid) and dissipated heat (dashed).
Now, in terms of cooling the brake discs and pads (our second question), the plot above will be of assistance. As you can see, the solid line depicts how much heat is produced and the dashed line shows how much heat is dissipated into the air. Eight seconds after the driver has stopped braking, a mere fraction of the produced heat has dissipated. In other words, in order to cool down the system sufficiently the brake needs to remain disengaged for a lot longer period than these eight seconds (100 seconds, in fact).
Further Reading
- Heat Generation in a Disc Brake model in the Model Gallery
- Step-by-step guide on how to build the disc brake model featured here

Comments (0)