Optimizing Fluid Sensors for Industrial Process Measurement
Product developers at Endress+Hauser improve the sensitivity of flow sensors for measuring fluid density, viscosity, mass flow, installation effects, and temperature for applications in the water, food, life sciences, and oil & gas industries.
By Rachel Keatley
October 2023
Start your car, fill a glass of water from the tap, or mix cooking oil into your brownie batter, and you are using a liquid that has been carefully extracted, processed, and assessed for quality. The staggering forethought and technology that goes into making such fluids usable by consumers is often out of sight yet requires precise measurement and monitoring.
When processing pharmaceutical products, how do you tell if a fluid is of high quality? If you are working with crude oil, how do you know how much you are extracting? If you are transporting water, how do you know the flow rate?
Questions like these, which impact confidence and bottom lines for water, food, life sciences, and oil & gas companies, are addressed by the manufacturers of flowmeters that are installed in pipelines and other equipment. At Endress+Hauser, product development teams work to develop and maintain accurate sensors for a variety of substances that require different measurement methods.
Measuring Coriolis Forces
To determine the properties of a fluid traveling in a pipe, sensors designed at Endress+Hauser measure the effects of the Coriolis force within a device inserted in the pipeline consisting of one or more oscillating measuring tubes.
The tube is excited prior to any fluid entering the device. When a fluid at rest fills the device, the tube oscillates uniformly. As soon as the fluid begins to flow through the oscillating tube, the fluid starts to exert a force on its walls. The oscillation of the measuring tube is seen as a rotation around an axis by the fluid particles. Since fluid particles are moving in a moving reference frame, they experience an inertial force acting perpendicular to their direction of motion and to the axis of rotation — the Coriolis force. Since the flow velocity relative to the axis of rotation has opposite directions in the inlet and outlet sections, the induced forces act to deflect the tube in an asymmetric fashion, causing a phase shift or time lag along the tube.
Different sections of the tube begin to oscillate with a time lag or phase shift caused by the twisting component in the motion of the pipe. This phase shift and the new oscillating frequency of the tube are a function of mass flow rate in the tubes and the density of the fluid, respectively. Hence, the signals from the meter can be interpreted to measure the mass or volume flow and ensure that the desired quantity of fluid is being transported.
Likewise, an increase in fluid viscosity leads to an increase in damping of the oscillations. The oscillating frequency is mainly a direct measure of the fluid density. For instance, oscillations will be faster but more damped with a substance like oil (lower density and higher viscosity) than a fluid like water (higher density and lower viscosity). Measuring the frequency and the damping of oscillations makes it possible to determine density and viscosity, and to monitor the process quality related to the fluid flow. The same physics effects would apply to an object, such as a cantilever, oscillating in a moving fluid.
Viscoacoustic Example
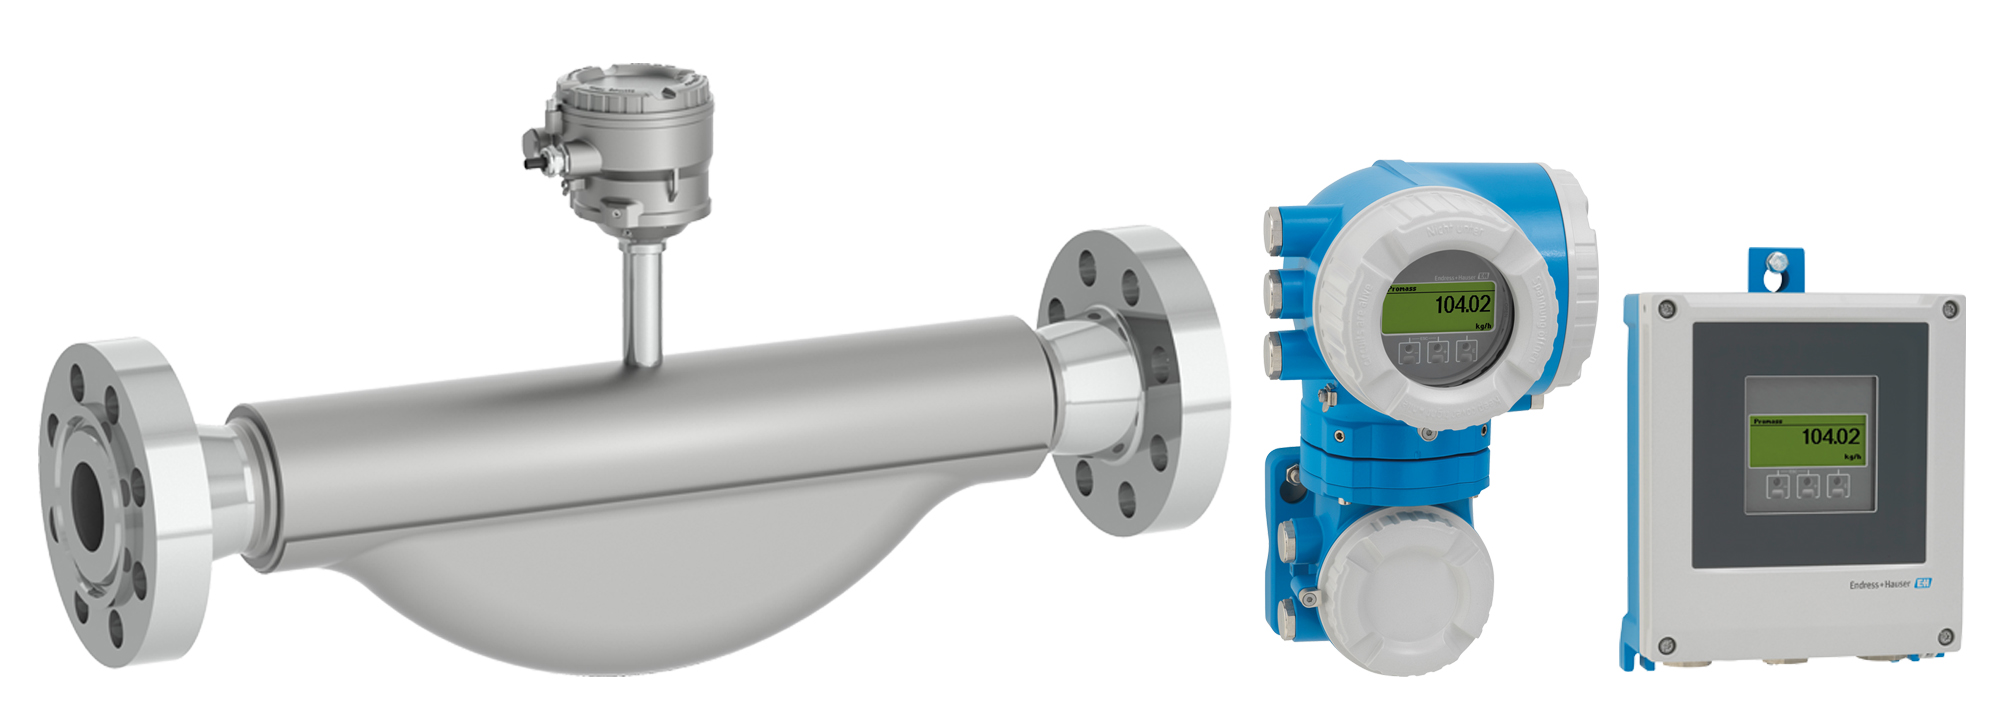
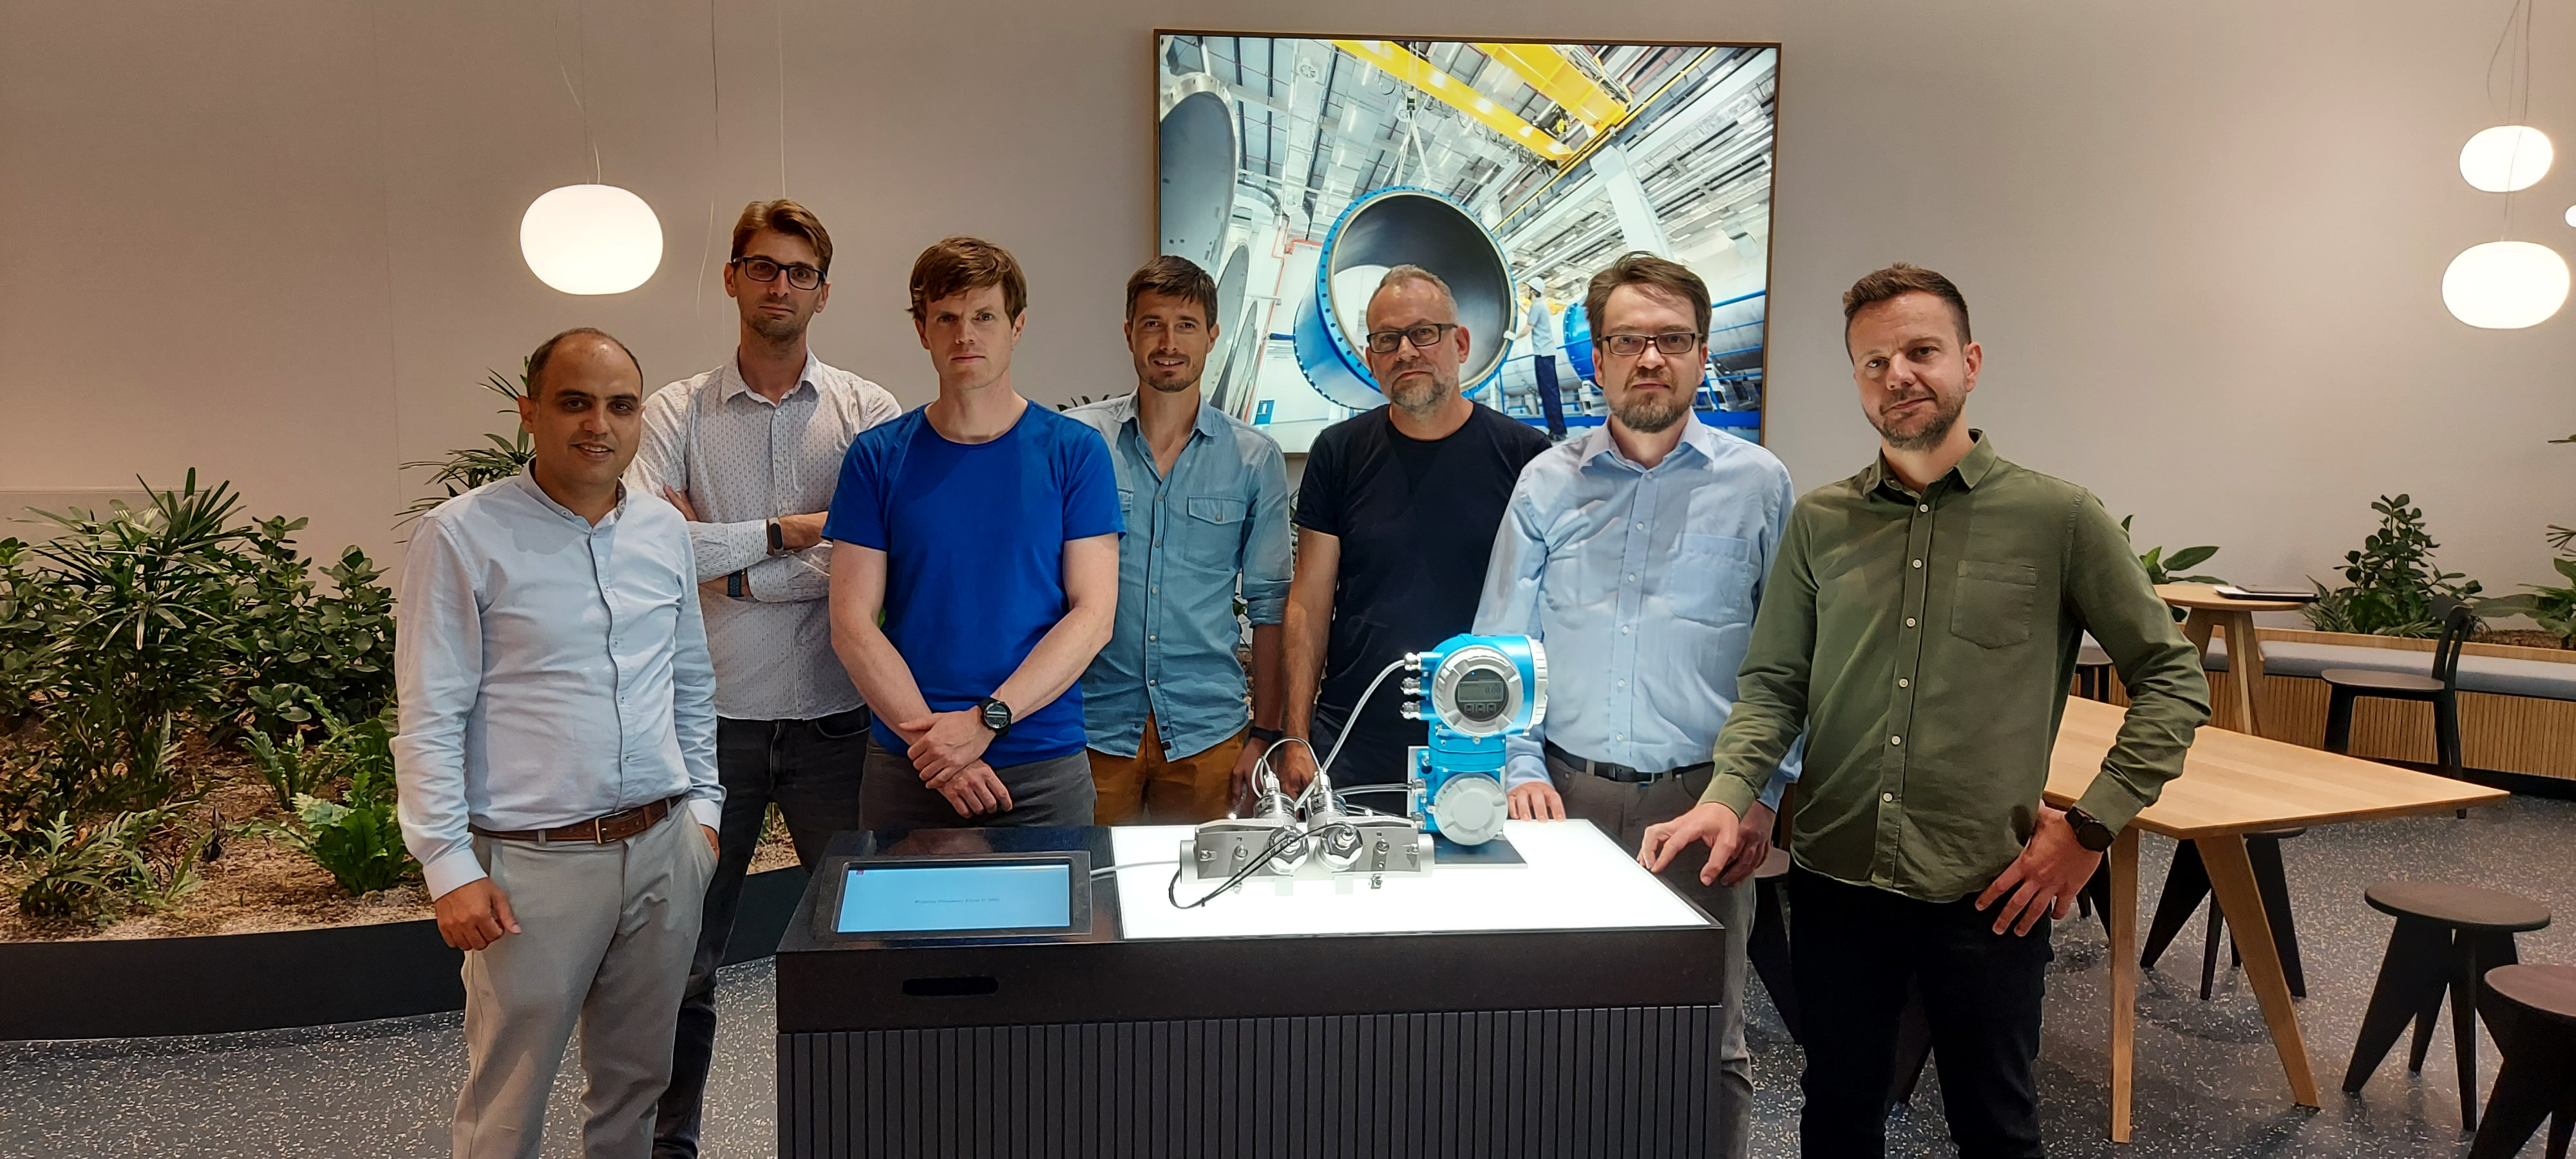
Dr. Vivek Kumar, a senior expert in numerical simulation at Endress+Hauser Flow, the branch of Endress+Hauser that manufactures these flowmeters (Figure 1), works to improve sensor performance. His modeling work has helped his team understand the acoustic, structural, and fluid flow effects in their flowmeters on a deep level. Understanding how the fluid–structure interaction and vibroacoustics affect the performance of a sensor enabled them to make various design adjustments to improve the performance and quality of the meter.
The team began their numerical analysis with a viscoacoustic model to understand the complex viscous damping that occurs when a viscous fluid flows through the oscillating tube.
Using the COMSOL Multiphysics® software, they analyzed the effects of fluid viscosity on the oscillating frequency of the tube. Figure 2 shows their simulation results predicting the frequency as well as the displacement of the tube for fluids of different viscosities. With the ability to simulate and better understand the physical effects that cause a shift in the frequency output of the meter, the team is able to leverage these effects to improve the performance of the meter. In this case, the variation in the tube damping is utilized to compensate for the viscosity effects on the measured density error.
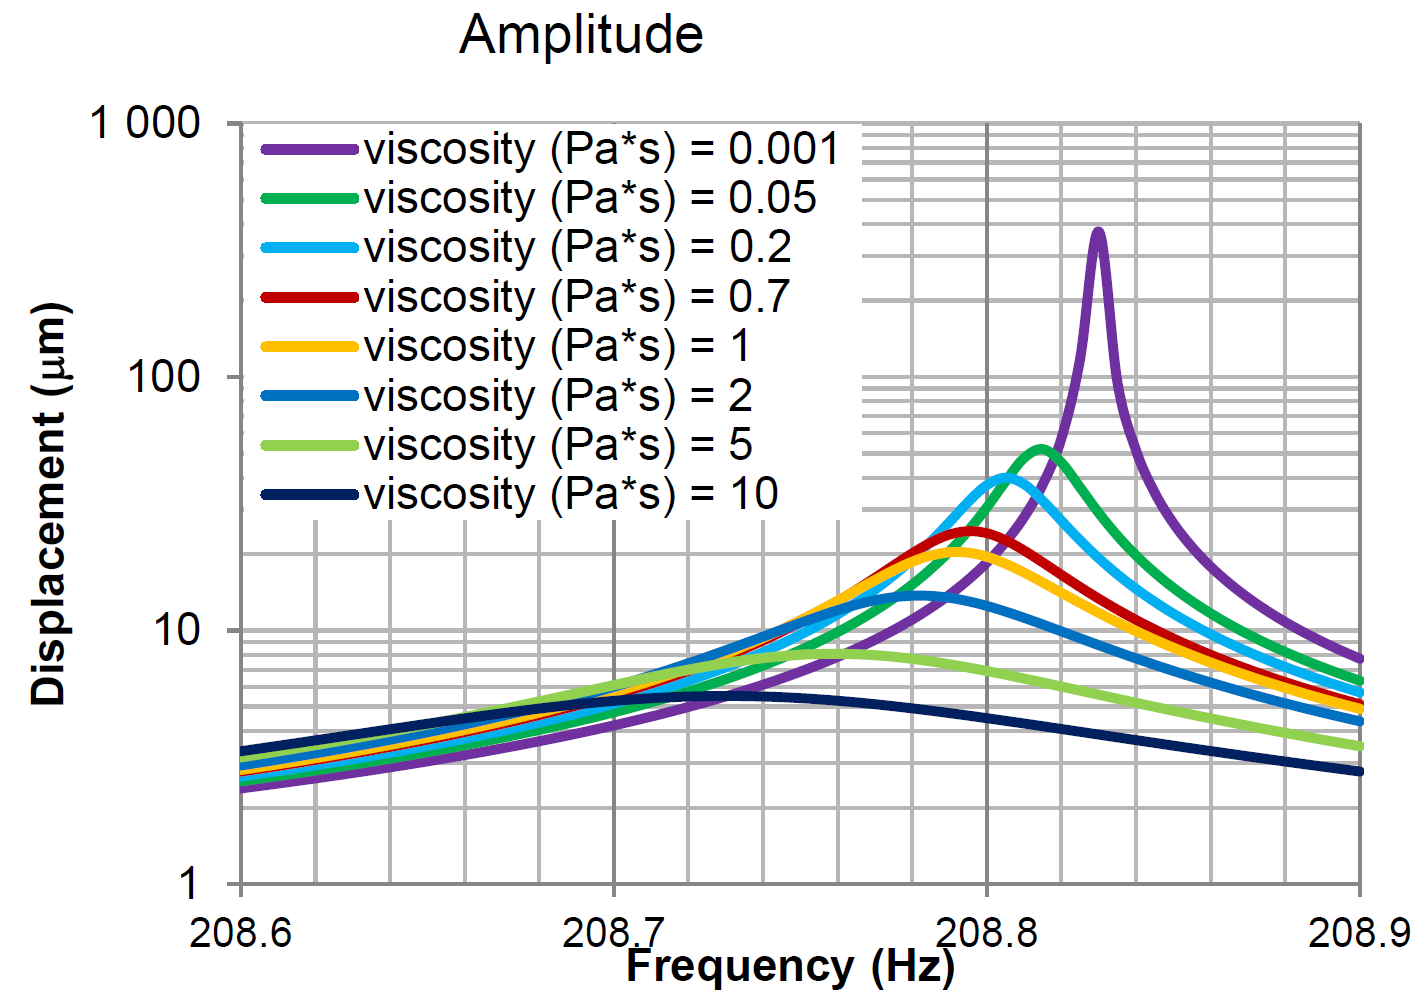
“We wanted to understand how different fluids would affect the sensor performance,” said Kumar. “Using simulation, we have been able to analyze different cases and ultimately optimize our device design to help our customers characterize material properties for the fluids they are using or extracting.”
Microscale Example
TrueDyne Sensors AG, a subsidiary of Endress+Hauser Flow, develops MEMS devices based on a similar concept. They design and test oscillating sensors to measure thermophysical fluid properties for many different uses. The team develops sensors for specific customer solutions, so it is essential that they know what type of oscillators would provide the best sensitivity for unique cases.
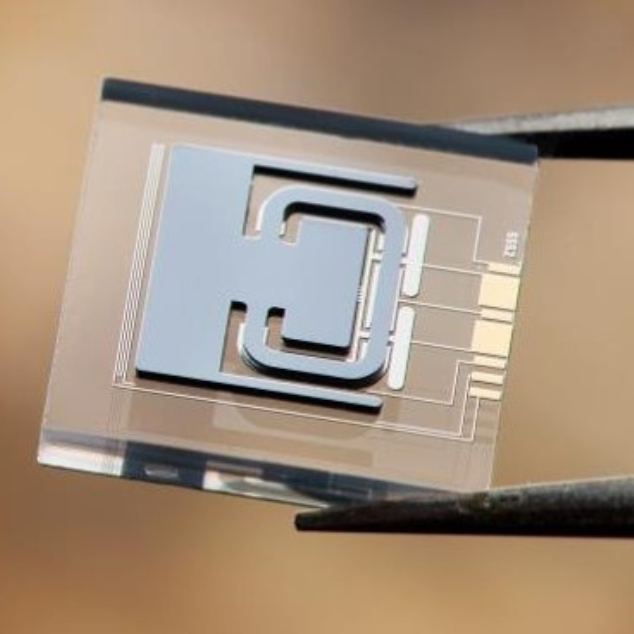
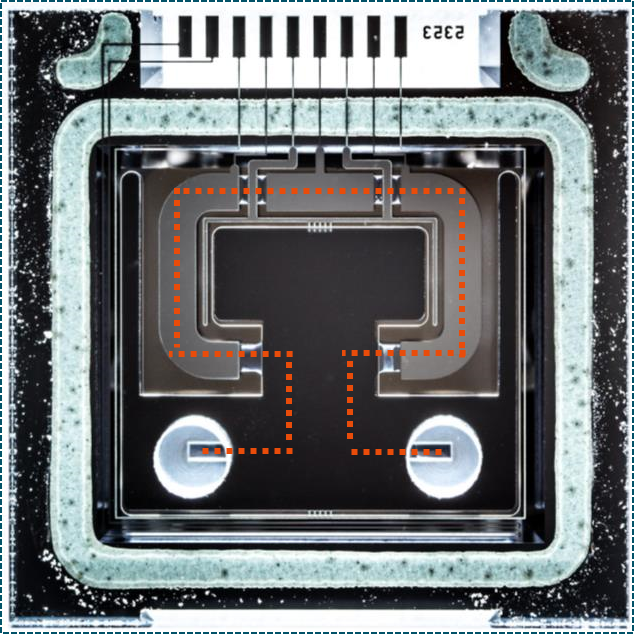
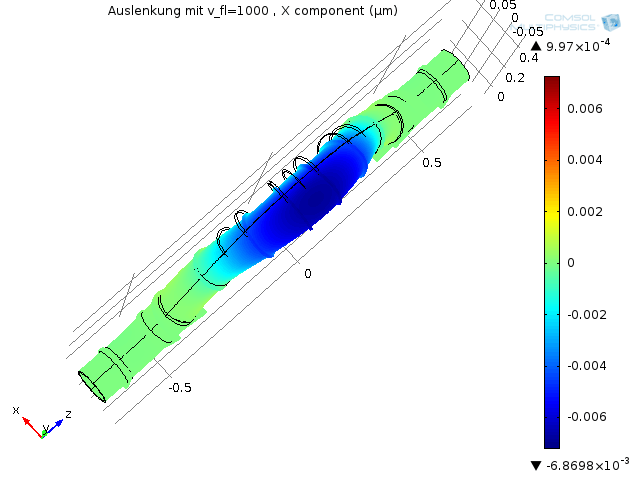
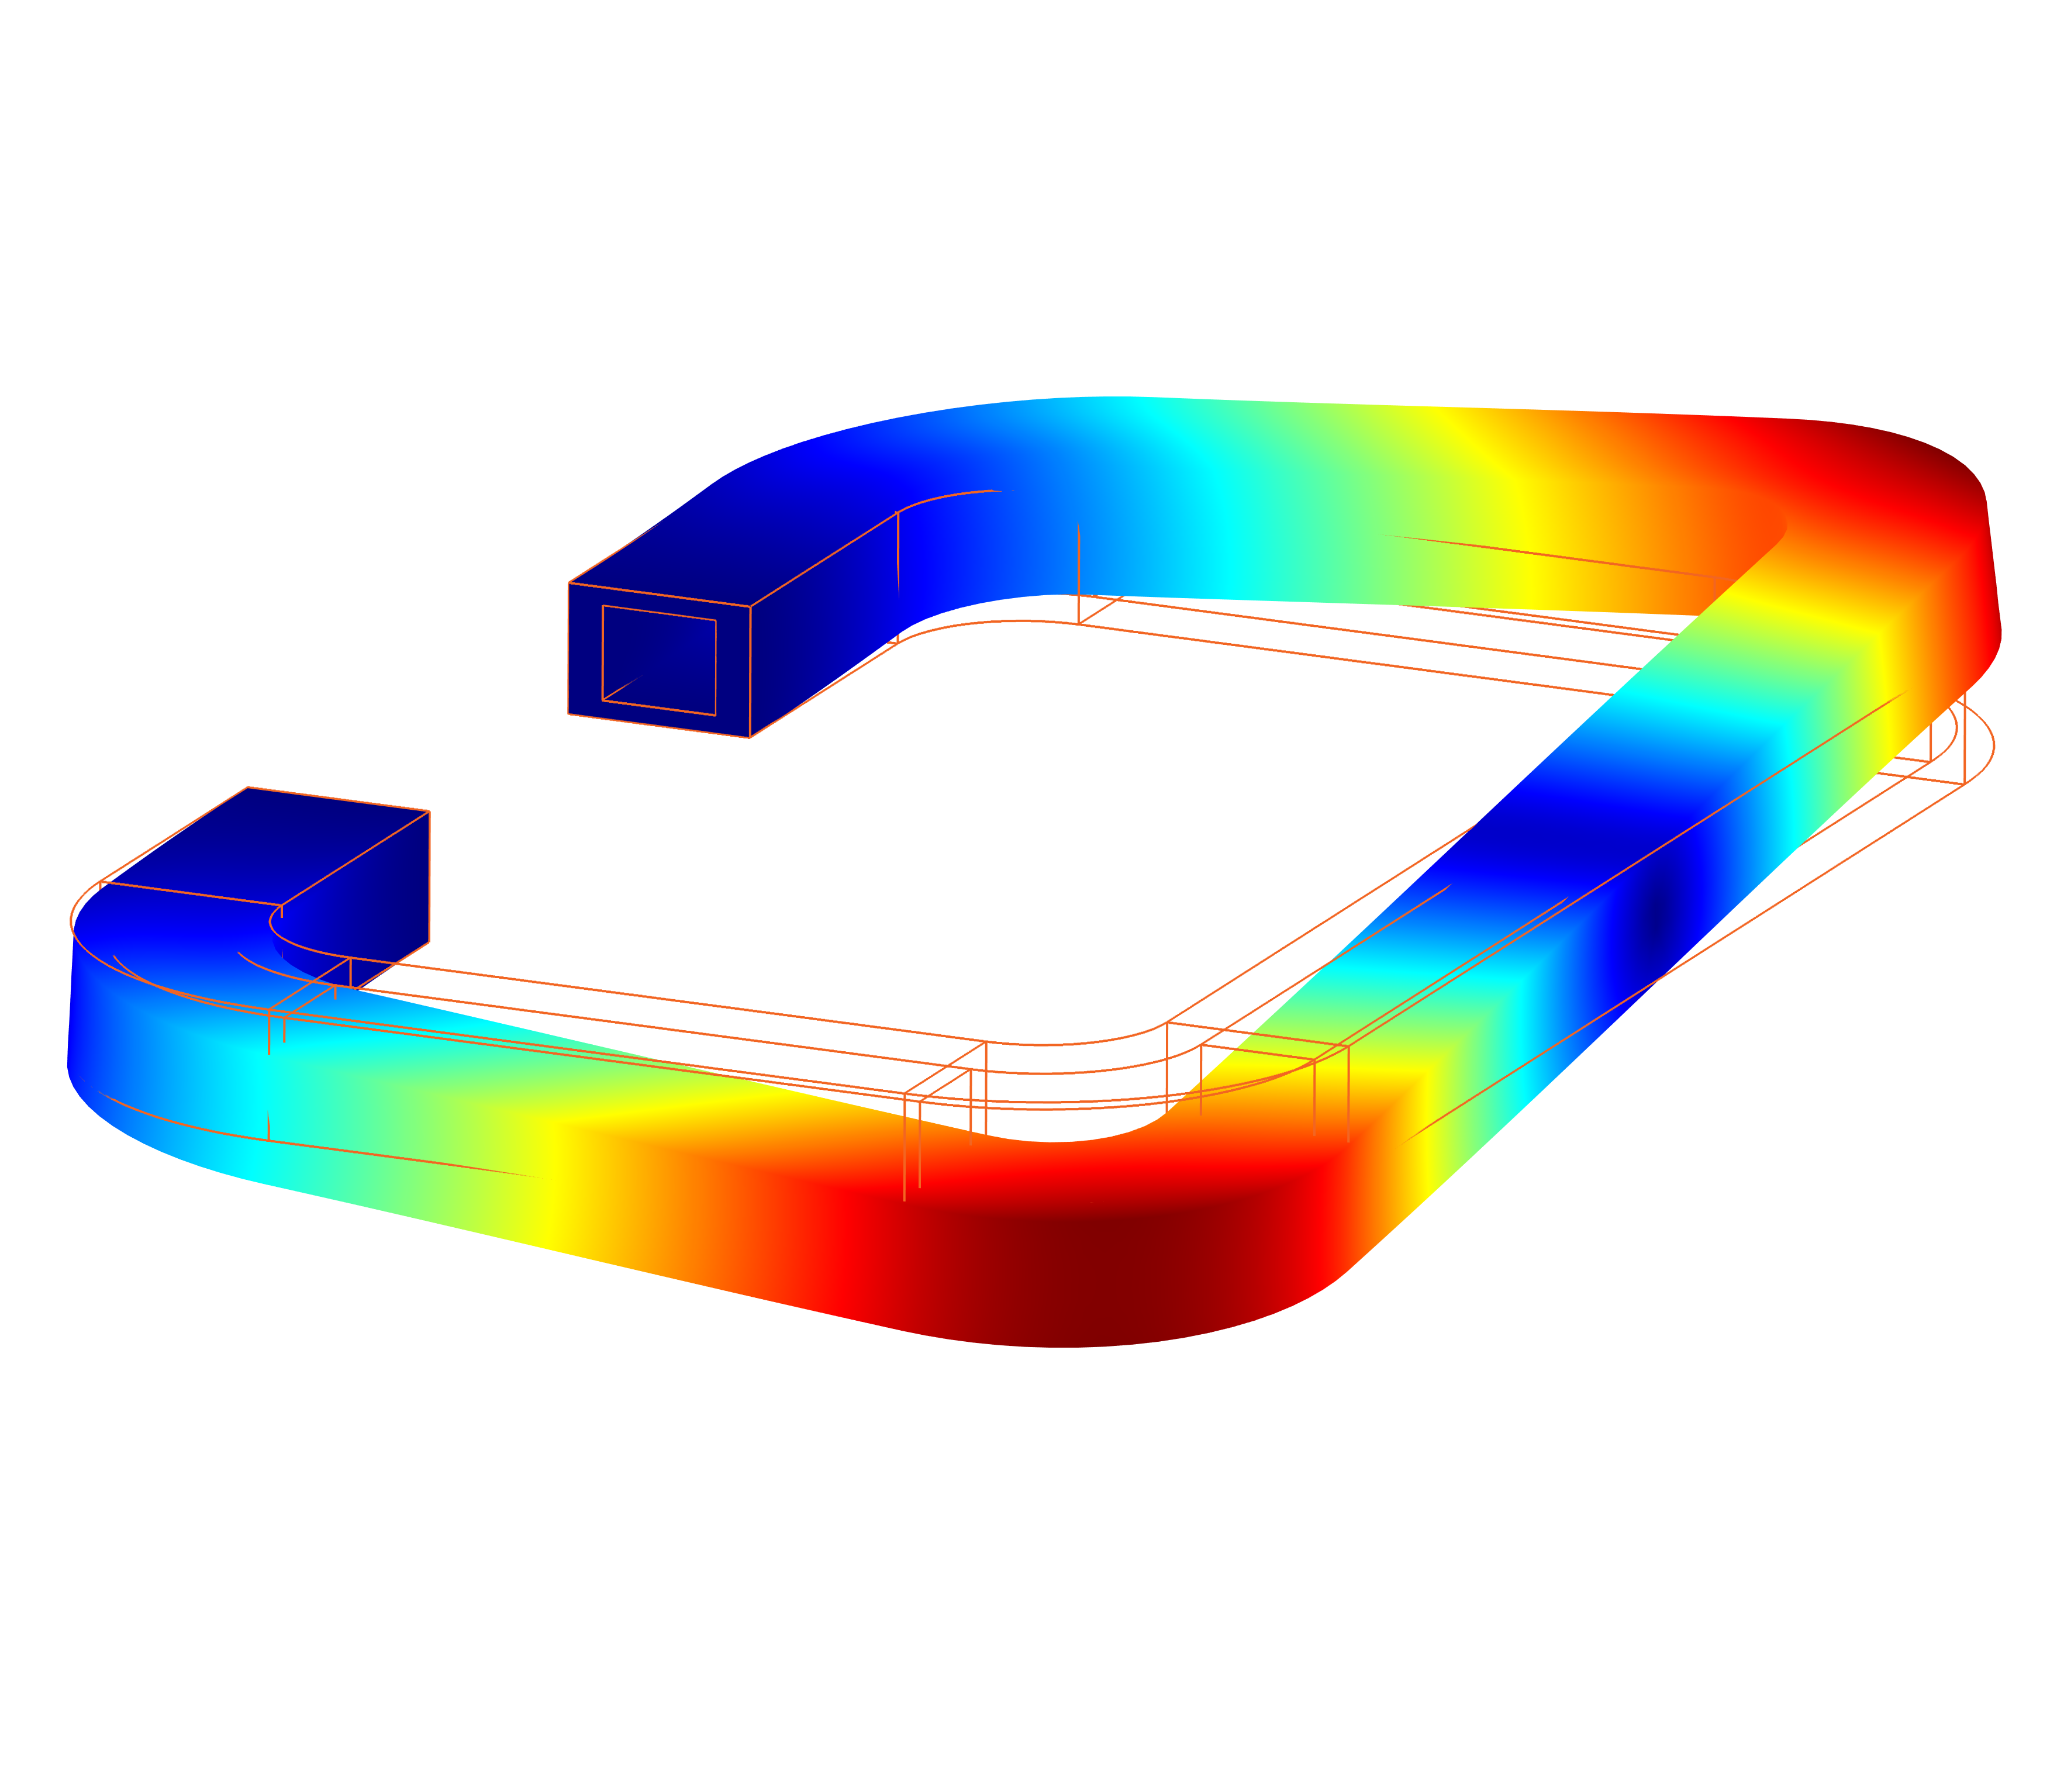
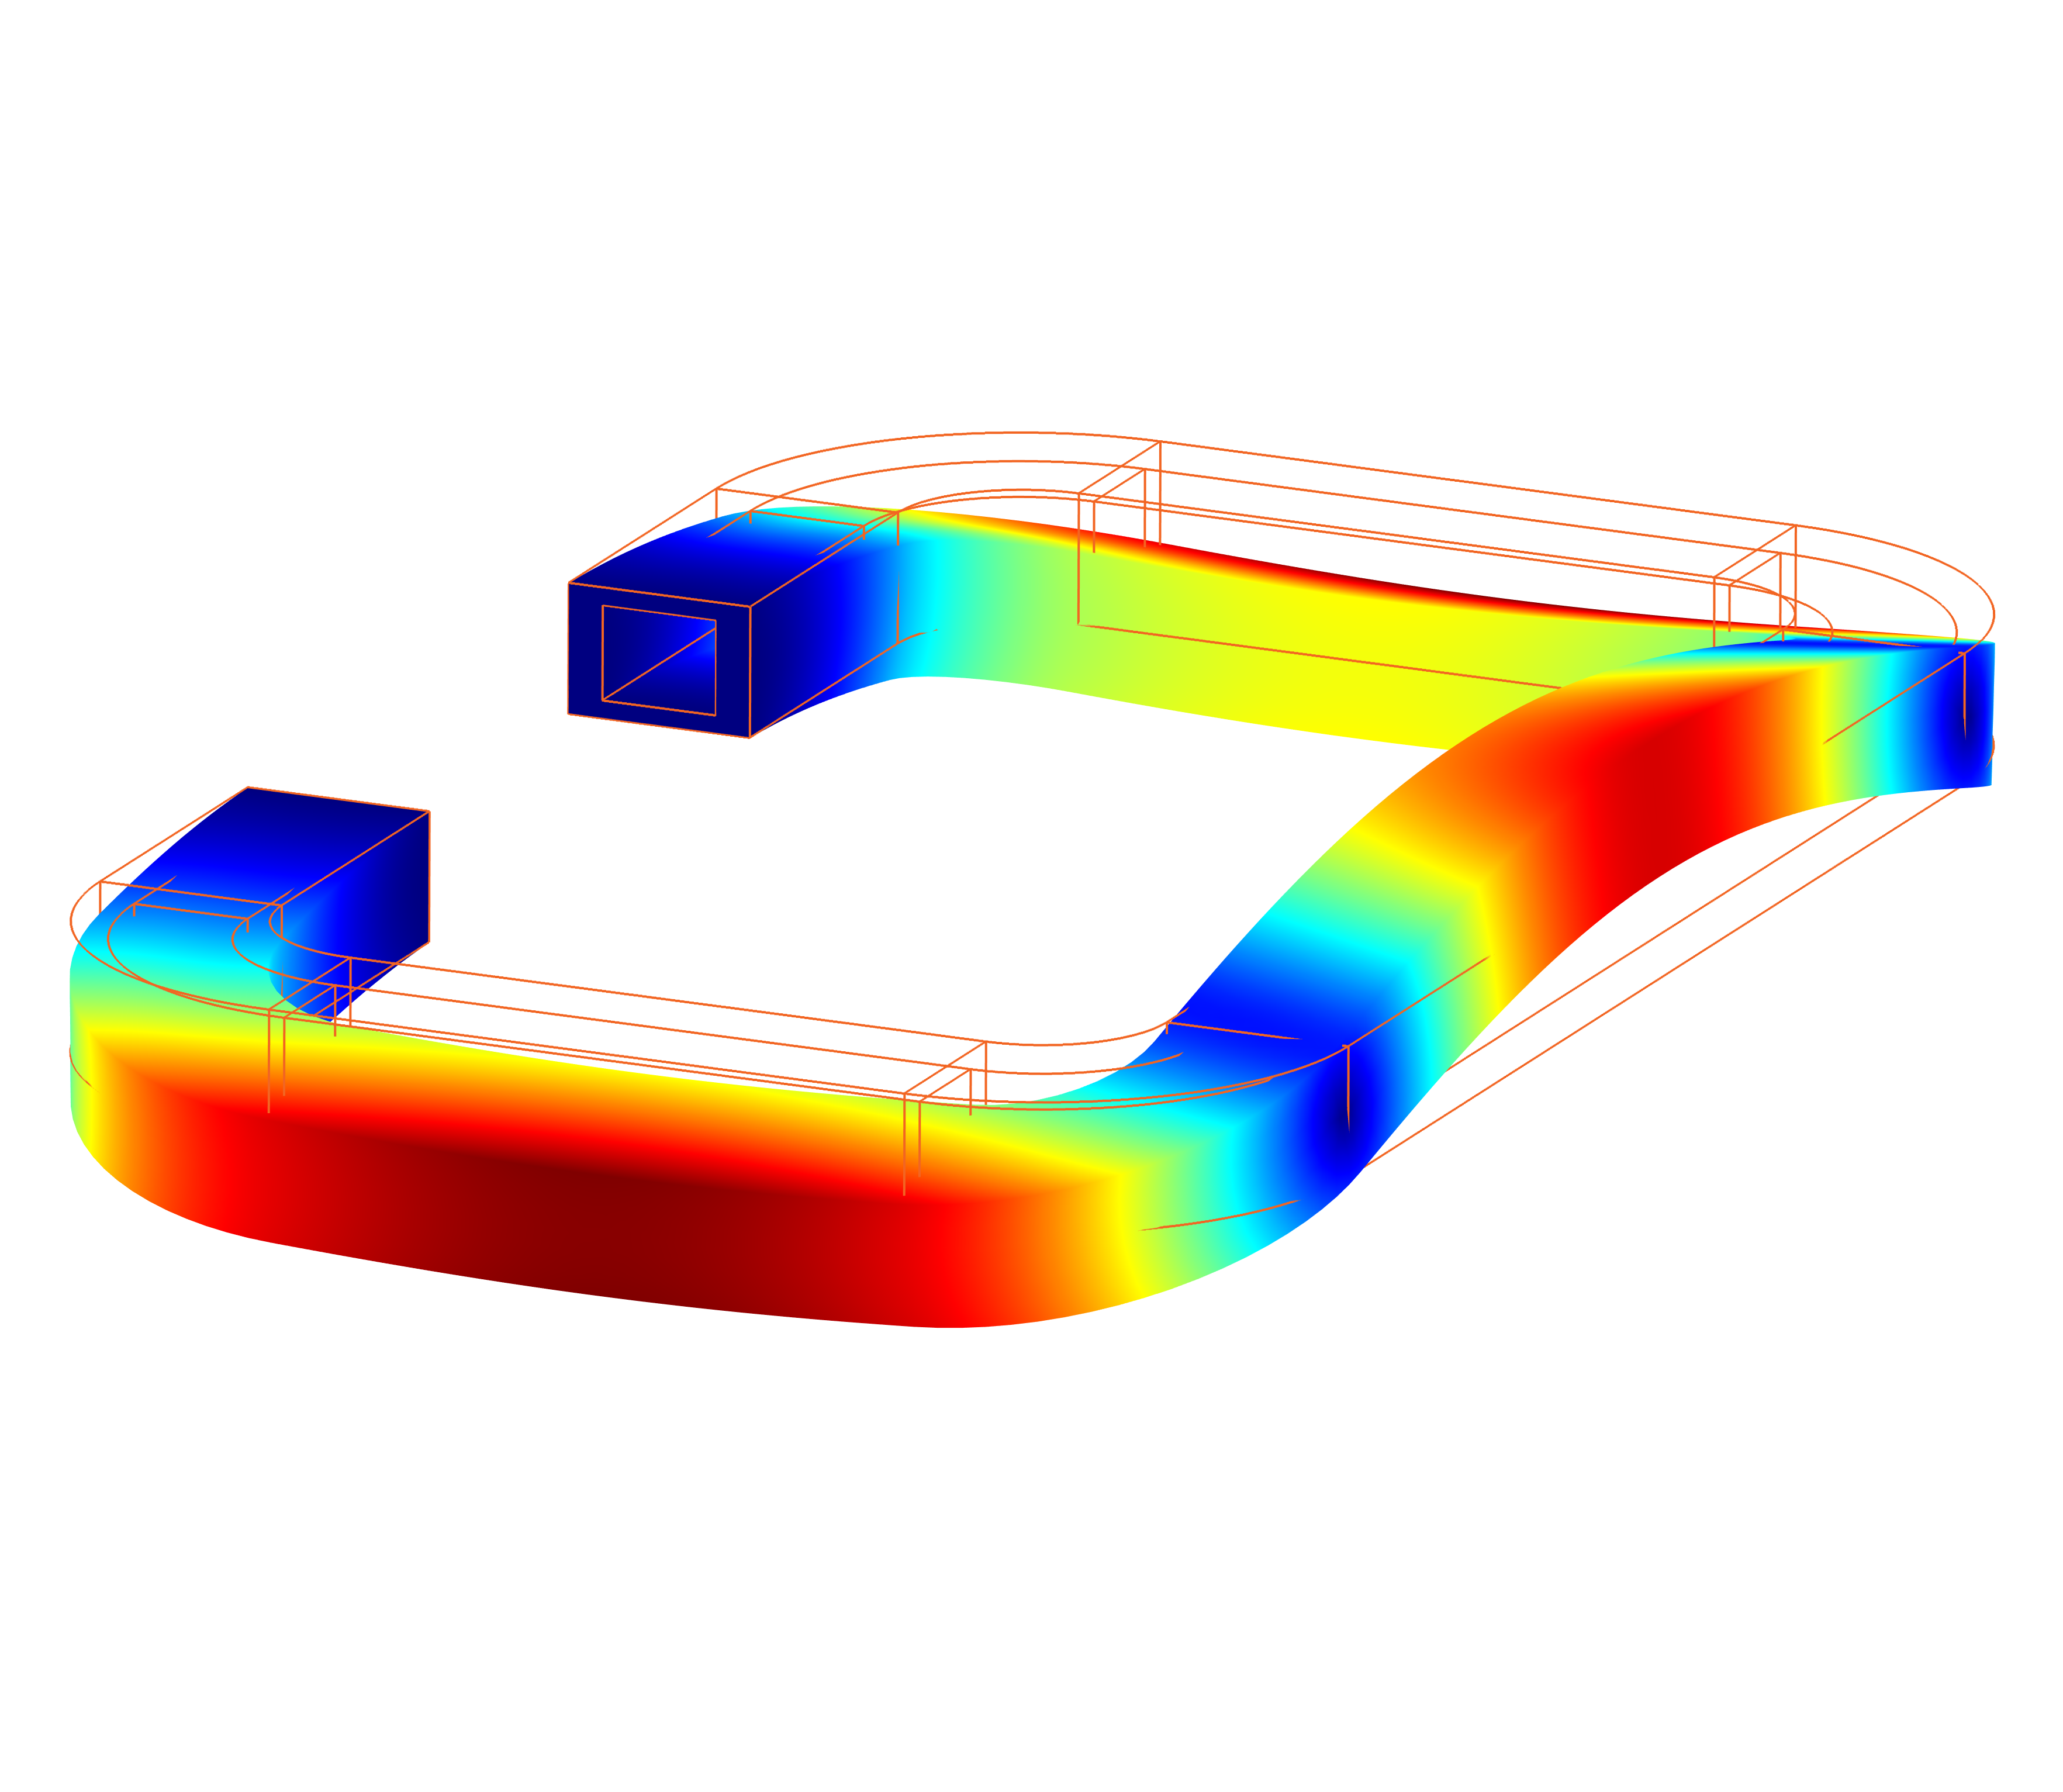
The MEMS Coriolis chip (Figure 3) utilizes a freestanding vibrating microchannel that operates on the same principle as the larger Coriolis flow sensor. As in the case of Coriolis simulations, a vibration analysis needs to be performed on the microchannel in order to determine fundamental eigenmodes and the oscillation rates of the different ends of the flow channel (Figure 4). This particular sensor is used for evaluating the density and viscosity of fluids, such as inert gases, liquid petroleum gas (LPG), hydrocarbon fuels, or cooling lubricants. Due to its dimensions, the sensor is suited to measure very small fluid quantities.
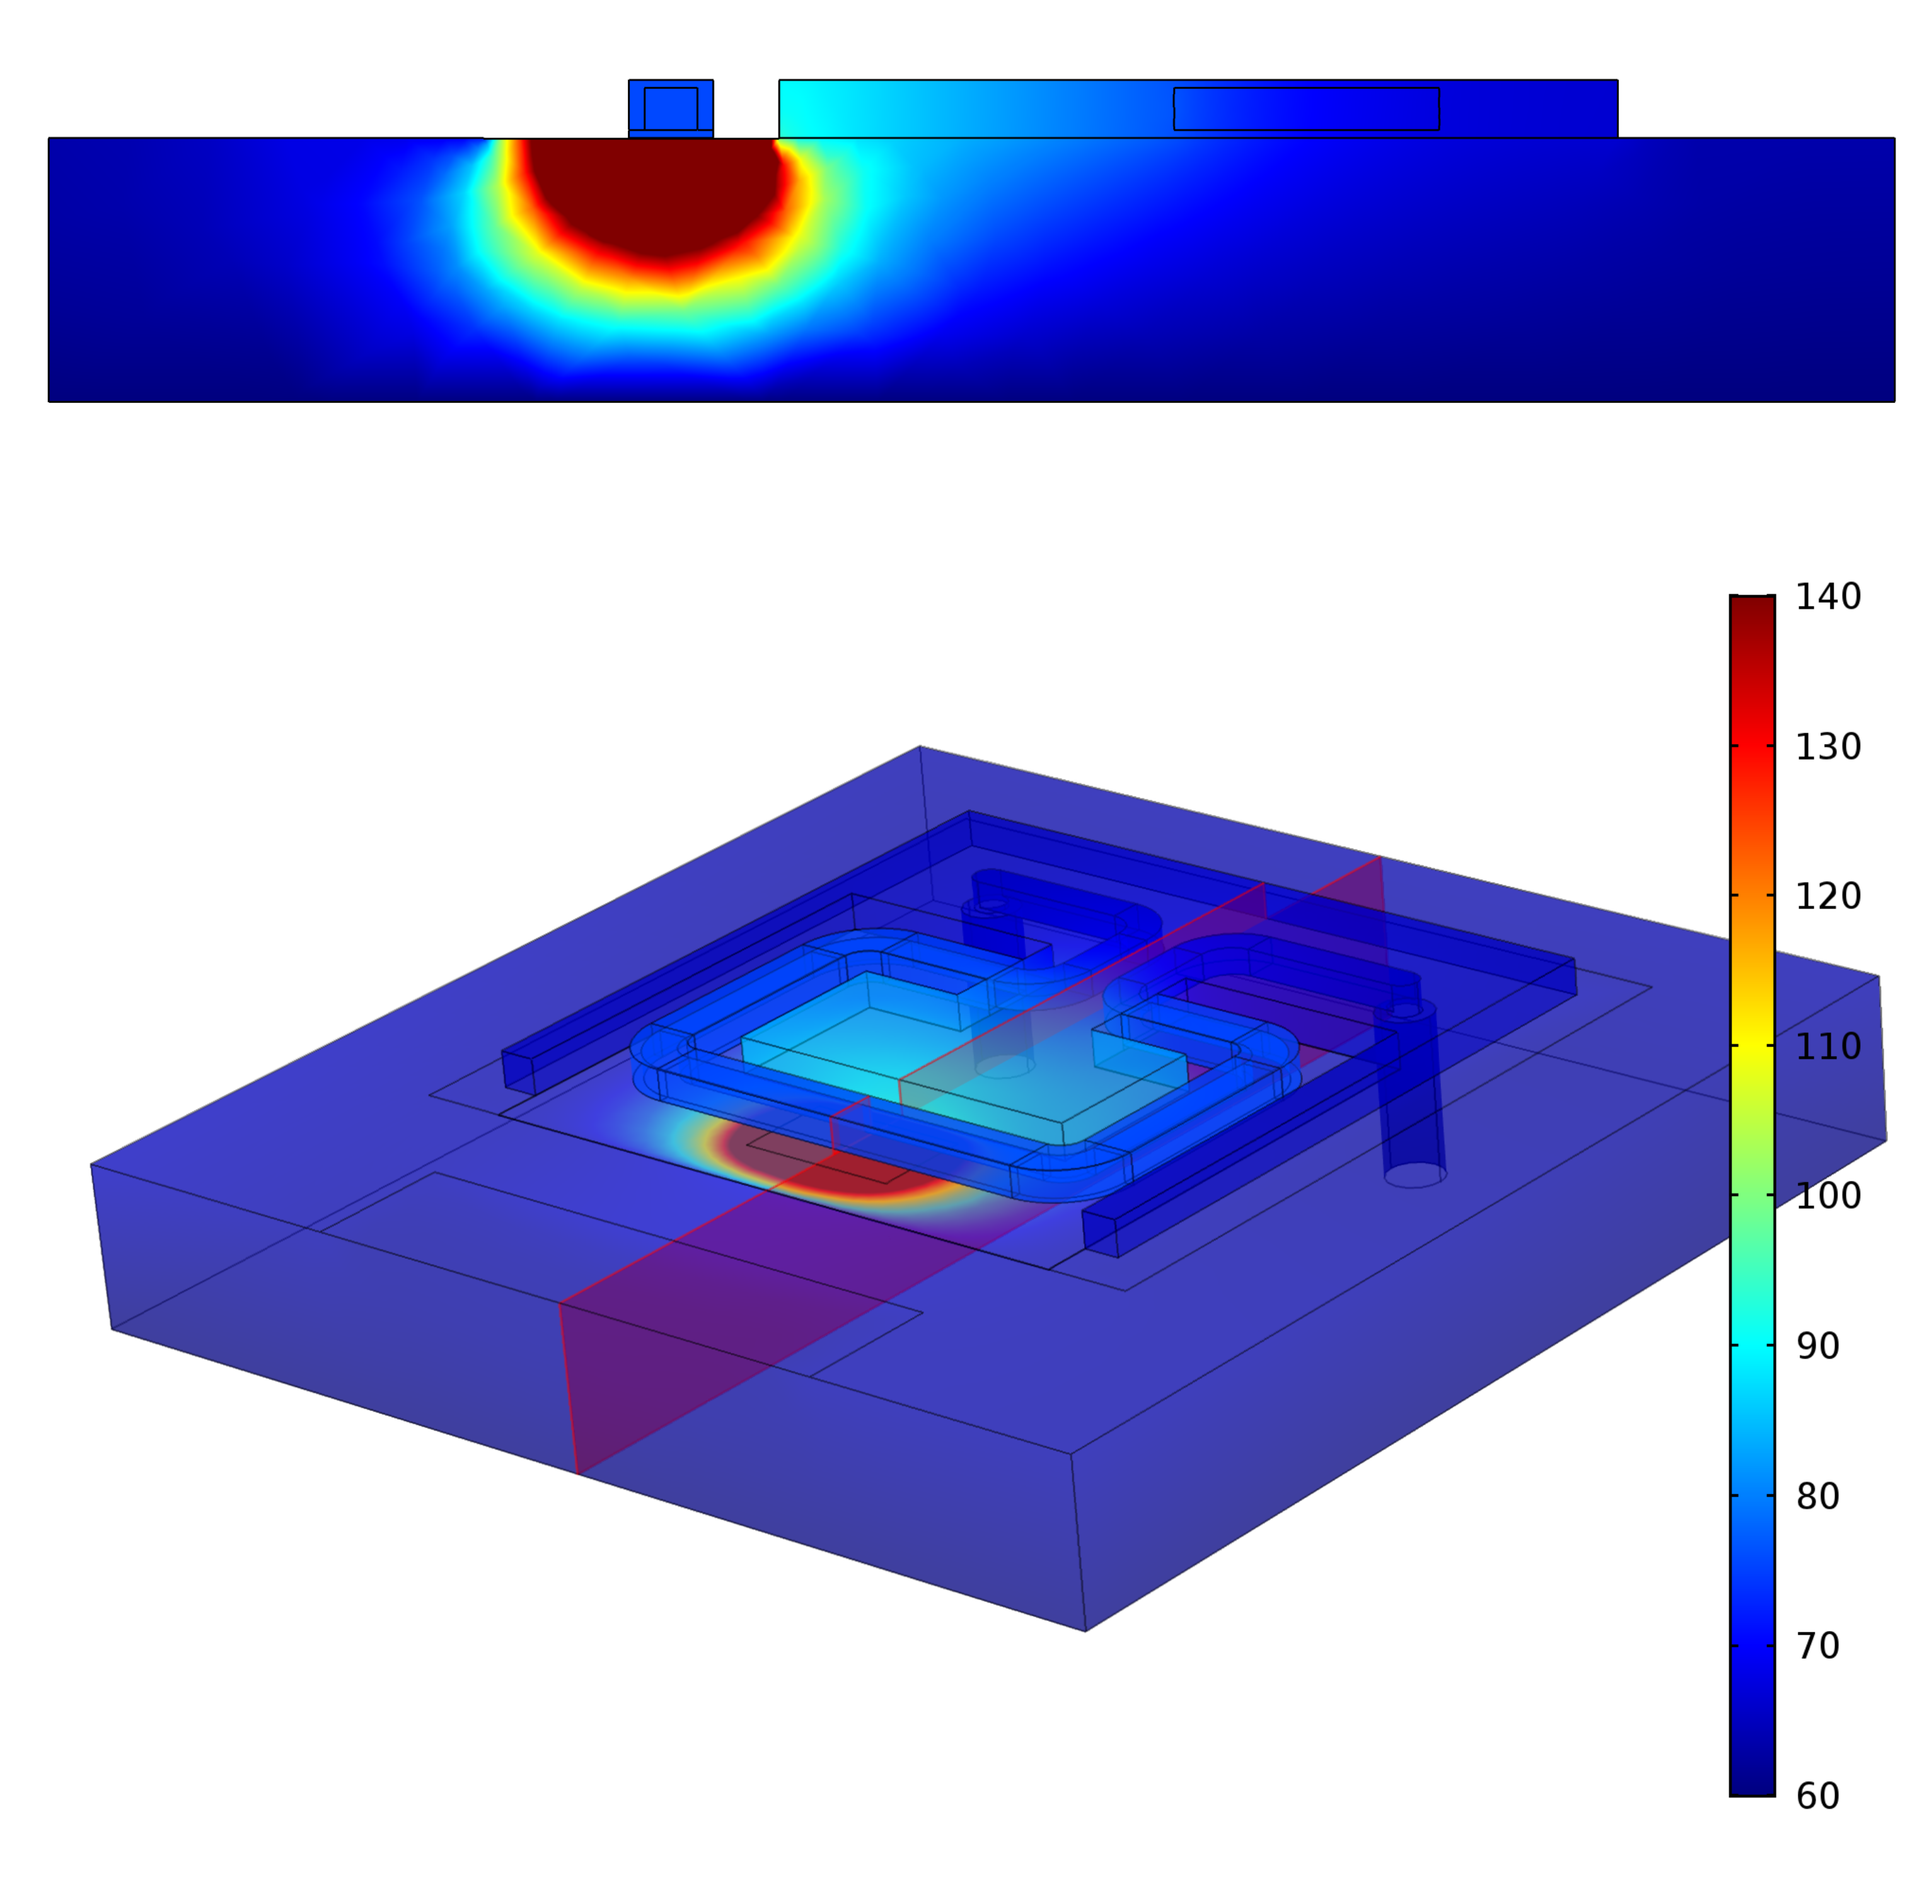
One specific challenge in such a small device is that the high voltage that is used to drive the excitations could cause the device to heat up if there is electrical failure. Given this safety risk, they carried out a thermal analysis (Figure 5) to determine where heat was dissipated in the chip and whether the fluid would become too hot. It was confirmed that the temperature did not exceed the limit thanks to the vacuum chamber surrounding the flow channel that minimized heat transfer between the electrodes and the fluid.
Optimizing Electromagnetic Flowmeters
Another type of flowmeter is the electromagnetic flowmeter, which make use of the Lorentz force. The Lorentz force acts on charged particles moving through a magnetic field. For these flowmeters, the particles are the ions of a conducting liquid, the movement comes from the liquid flowing through the pipe, and the magnetic field is supplied by a set of coils that are above and below the pipe. The result is an electromagnetic potential across the pipe, which can be measured with a pair of electrodes. The signal is typically only on the order of a few hundred mV per m/s; if you get the design just right, the measured potential is proportional to the flow velocity and independent of the conductivity.
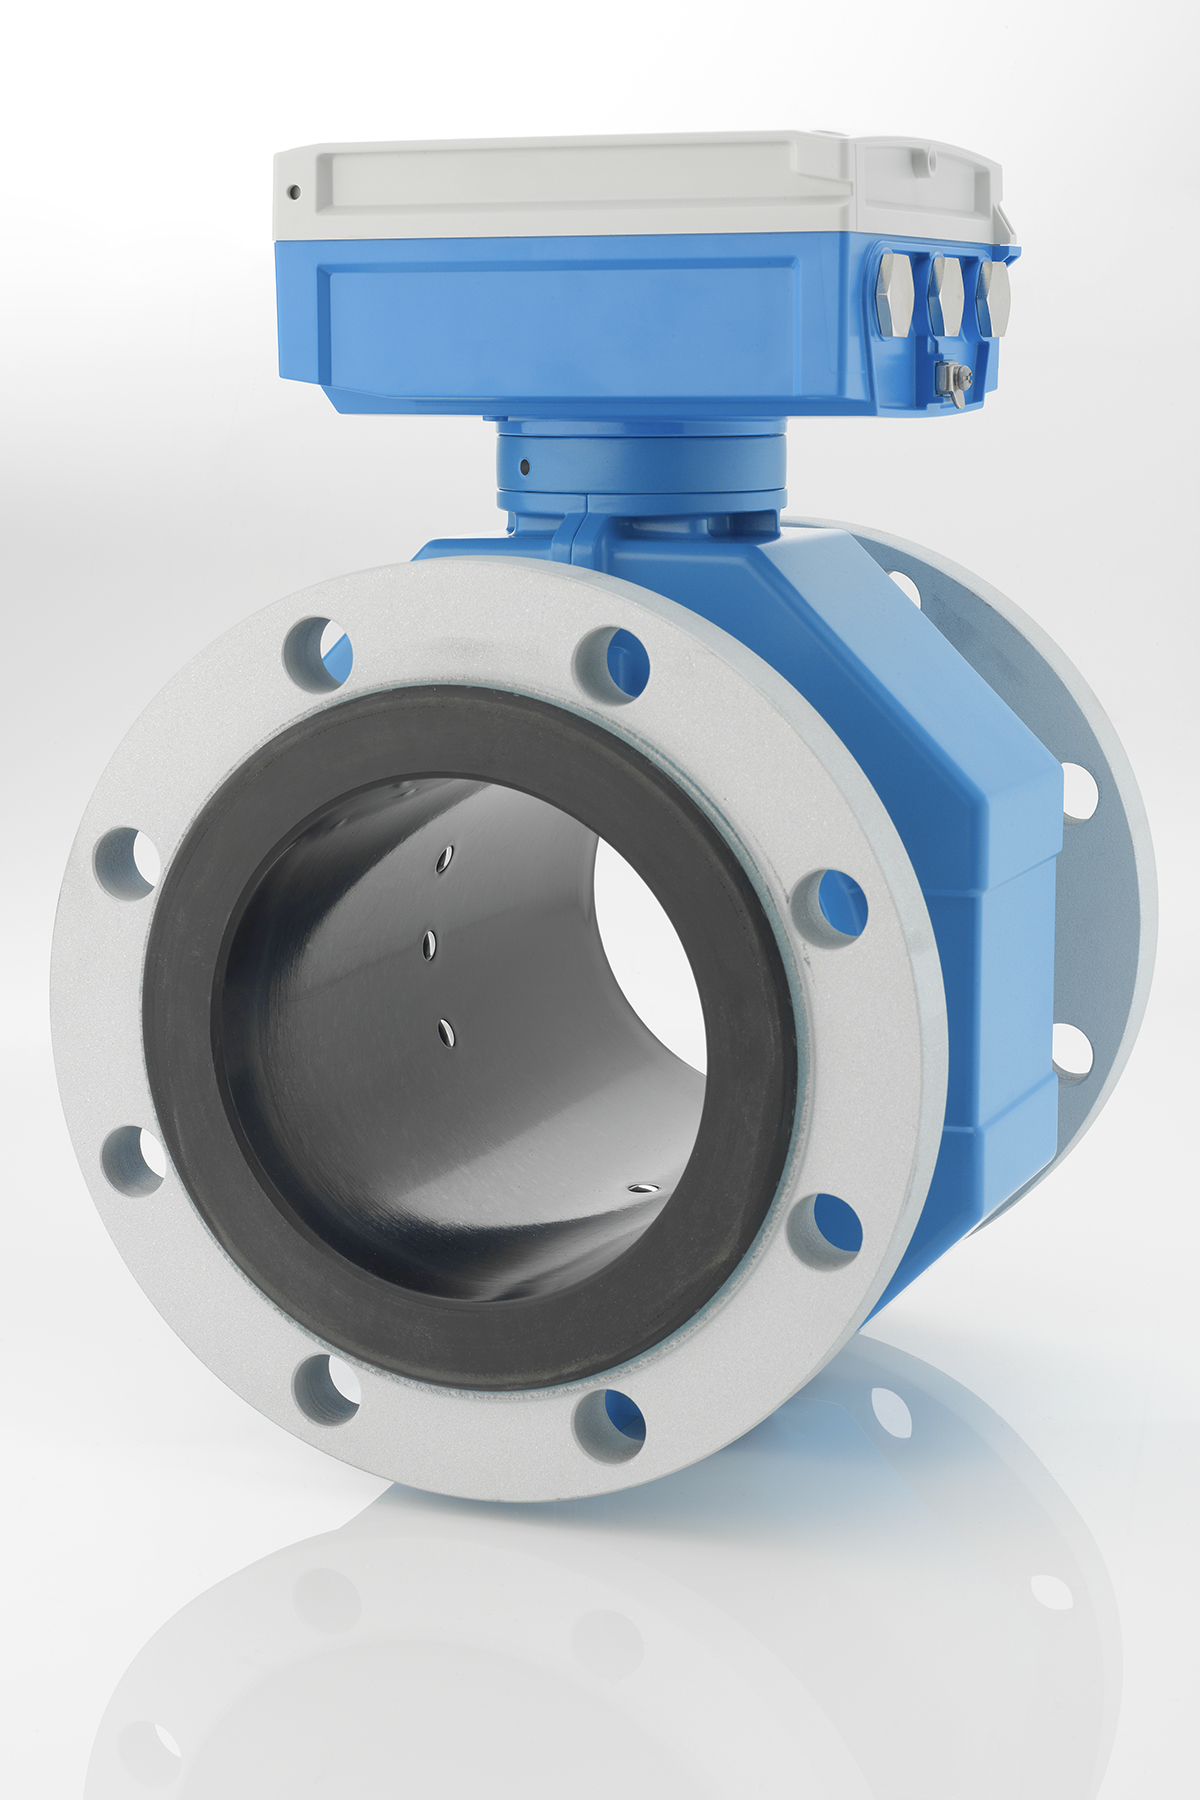
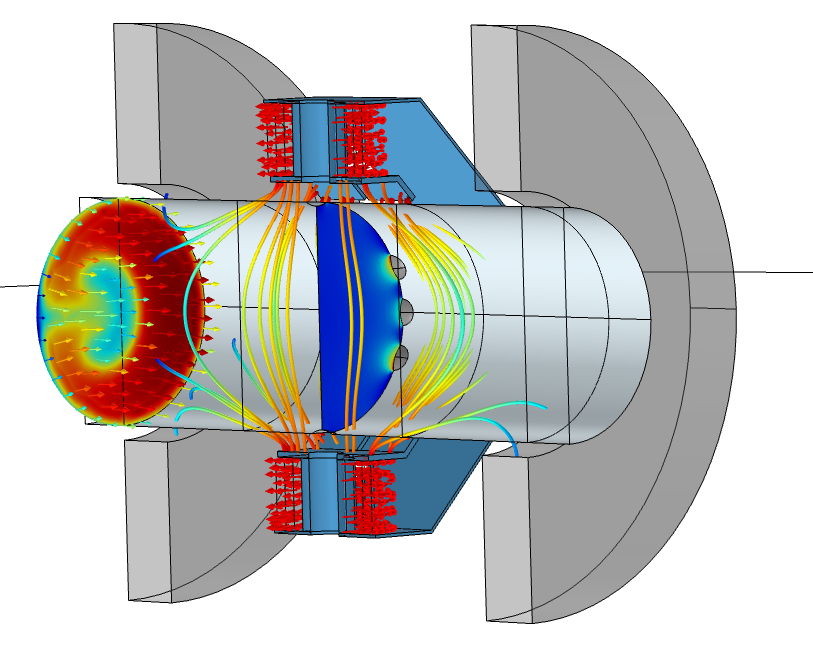
The simulation of electromagnetic flowmeters calls for multiphysics modeling software to calculate the magnetic field generated by the coils and the flow velocity distribution in the pipe, and combining them to calculate the electric potential. Electromagnetic flowmeters are typically specified with a measurement accuracy of a few fractions of a percent, so the simulations must be extremely accurate. At Endress+Hauser Flow, simulation experts Dr. Simon Mariager and Dr. Simon Triebenbacher used such simulations to remove one of the main limitations of electromagnetic flowmeters: the sensitivity to the flow profile.
While conventional electromagnetic flowmeters are surprisingly robust, changes in the flow profile — for instance, those occurring after a bend in the pipeline — do result in measurement errors. For this reason, manufacturers recommend that these flowmeters have a certain inlet length of straight pipe (typically 5–10 times the size of the nominal diameter) before the sensor. However, this recommended design can make the installation of electromagnetic flowmeters a challenging process, as they are available for pipe sizes ranging from a few millimeters to several meters. Getting rid of the inlet length was the goal of a recent development project at Endress+Hauser Flow. The job called for optimizing the weight function of the flowmeter. Theoretically, this requires the curl of the weight function to be zero everywhere, but this is not mathematically possible with real-world geometries.
Instead, extra measurement electrodes were used to provide the necessary degrees of freedom. With that, the team still needed to determine how many electrodes were required and where they should be placed. They used simulations of the pipe flow after flow disturbances, such as bends and valves, to predict the performance of the electromagnetic flowmeters in a variety of real-world applications and optimize their design to a degree where the new flowmeter became virtually independent of the flow profile.
Serving Company and Customer Needs
For the Endress+Hauser simulation team, the functionalities of the COMSOL Multiphysics® software have been helpful in their daily research and development work to optimize flow measurement devices and develop top-performing meters. The multiphysics analyses provide them with insight that reduces the overall time and effort spent on testing and prototyping and allows them to produce sensors of the highest quality.
Dr. Christof Huber, principal expert of advanced sensor technology at Endress+Hauser Flow, feels inspired when he sees how his models result in changes to the device designs that improve the experience of Endress+Hauser customers. “These tools are used to solve customers’ problems; we see this working in the field, our innovation in practice; we see the return, the reason we are doing this,” said Huber.
Endress+Hauser Flow is a company of the Endress+Hauser group, headquartered in Reinach, Switzerland. TrueDyne Sensors AG is a subsidiary company of Endress+Hauser Flow.


Editor's note: This article was originally published in June 2018. It was updated in October 2023 to include new information about the project and development team.