
Many fatigue assessment metrics are based on stress evaluation; however, they are incompatible with high-performance optimization methods such as gradient-based optimization. This makes it challenging to improve fatigue performance by directly applying optimization methods. This blog post shows how stress minimization can be used as a heuristic approach to improve fatigue behavior. The method relies on gradient-based optimization to improve thousands of design variables while maintaining the mass and stiffness characteristics of the design.
Understanding Fatigue
When a part is subjected to repeated loading, small cracks can develop in the material. These cracks may then begin to grow with each load cycle, until the propagation enters a rapid phase, leading to final structural failure of the part. This progression of initiation, propagation, and final failure defines the fatigue fracture process. In most practical situations, the goal is to prevent crack initiation altogether, as controlling the propagation phase once a crack has initiated is a daunting task. The purpose of a fatigue analysis is to compute the number of load cycles that the part can tolerate until this happens. This defines the fatigue life.

The de Havilland Comet was an airplane that broke apart midflight due to fatigue cracks having initiated at punched rivet holes near the windows. To prevent this from happening again, later versions of the plane used windows attached with glue. Image by Completeaerogeek. Licensed under CC BY-SA 4.0, via Wikimedia Commons.
The initiation of fatigue cracks depends on the loading on the part and the stresses that the loading produces. It should be noted that fatigue cracks can initiate at stress levels well below the yield stress of the material and that the repetitiveness of the loading is a main driver for fatigue crack initiation. From a design standpoint, however, it can be useful to disregard the cyclic behavior of the loading and, instead, consider a static load case to identify regions of high stresses.
Stress Minimization
The minimization of the maximum stress is a common objective in structural mechanics, but such optimization problems are difficult to solve in practice since the precise location of the maximum stress can change during the optimization. Therefore, it’s common to use stress aggregation techniques that approximate the maximum stress, and it’s particularly popular to use a p-norm of the von Mises stress:
The accuracy of the approximation improves as p\rightarrow\infty, but this also causes the gradient to change more abruptly, leading to numerical problems. Accordingly, values larger than 10 are rarely used for topology optimization. However, this post focuses on shape optimization where larger values up to 50 can sometimes be used without introducing numerical problems. The approximate maximum stress, \sigma_\mathrm{max}, and variants of it can be used to constrain the stress in shape and topology optimization, as demonstrated in the COMSOL Application Gallery (for instance, in the Optimizing a Flywheel Profile and Topology Optimization of Loaded Knee Structure with a Maximum Stress Constraint models). In the following examples, we will show that this objective can be used as a heuristic approach to shape optimization with respect to fatigue behavior.
Results for a Bracket
The first example is a bracket geometry, which is used to demonstrate various concepts in structural mechanics. (For more information, check out the Bracket — Stress Optimization with Fatigue Evaluation model.) In the image below, the loading and boundary conditions are illustrated together with the stress distribution. Springs are used on the fixed holes to avoid artificial stress concentrations. Alternatively, the model can be extended to include the bolts.

The plot shows the boundary conditions (left) and initial stress distribution (right). The stress is concentrated near the fillets in the top of the bracket.
The optimization uses the p-norm (p=50) noted in the previous section as an objective function, but constraints are also added to avoid a heavier or less stiff structure. The 3D examples considered here use the Free Shape Boundary feature, but the COMSOL Multiphysics® software has a variety of other built-in features for shape optimization, as explained in our blog post “Shape Optimization in Electromagnetics: Part 1”. Using the Free Shape Boundary feature changes the shape of the problematic fillet to reduce the stress concentration, which improves the fatigue properties (illustrated below).

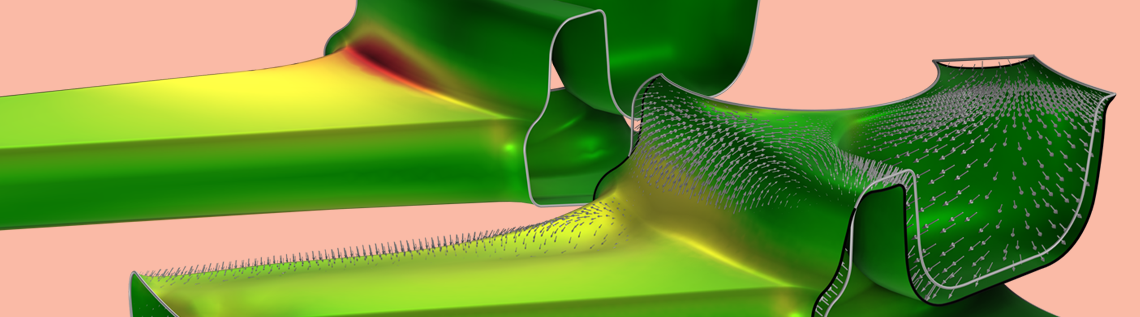
The number of cycles to failure is plotted for cutouts of the initial and optimized designs (left and right, respectively). The shape change is also illustrated with arrows in the middle cutout, where the blue and red areas correspond to the removal and addition of material, respectively.
Generally, a component will fail once the fatigue life is exceeded for any part of it, so it’s the minimum number of cycles to failure that is the most relevant number. Ideally, you would want to use this as an objective directly, but there is good agreement between this number and the p-norm objective, as can be seen in graph below.

The p-norm objective is plotted together with the minimum number of cycles to failure. Some iterations improve the p-norm without improving the minimum number of cycles to failure, but there is good correlation between the two.
Von Mises Stress and Fatigue Life
How can it be explained that a pure von Mises stress minimization correlates so well with an improvement in the fatigue life? The fatigue life of a component is affected by many factors, where the stress range is the major contributor. It is also strongly affected by the mean stress. In the common case where the loads are fully reversed, the mean stress is zero everywhere.
Usually, fatigue cracks originate on a free surface at a stress concentration. On a free surface, a state of plane stress prevails, but in practice it is common that the stress state is almost uniaxial. This means that, for example, the first principal stress and the von Mises equivalent stress will be the same.
In a situation where you have a mixture of a static load case providing a mean stress and another load case for the pulsating load, this approach may not necessarily be optimal. But even then, there is a large chance of success, since at a stress concentration, it is common that different types of external loads result in similar stress patterns.
Results for a Wheel
The second example we will look at is a wheel rim, taken from the Wheel Rim — Stress Optimization with Fatigue Evaluation model. This model is conceptually identical to the bracket, except for four points:
- There are several load cases, and the fatigue analysis searches for the worst combination (using the Findley criterion), so a weaker relation to the maximum stress is expected.
- The fact that there are more load cases also leads to more constraints.
- Sector symmetry is imposed for the shape optimization (not the physics).
- The fatigue usage factor is used in results (instead of the fatigue life), and this can be thought of as a reciprocal safety factor.
The wheel geometry, constraints, and boundary conditions are illustrated below. Simple fixed boundary conditions are used for the bolts, which give rise to artificial stress concentrations, so these areas are excluded from the fatigue analysis.

The different load cases are illustrated with arrows in different colors (left). The initial fatigue usage factor is plotted to the right, and this plot considers all load cases, responding to a full revolution of the wheel. Note that a coarse mesh can be used for the spokes but not used for the fatigue or stress evaluation. The wheel is also subjected to a load from the air pressure in the tire, but this is excluded from the illustration.
The optimization still uses the p-norm objective (p=20) together with a constraint on the mass, but this example considers more load cases, so there are more constraints. The figure below illustrates how the optimization improves the fatigue life by modifying a fillet.

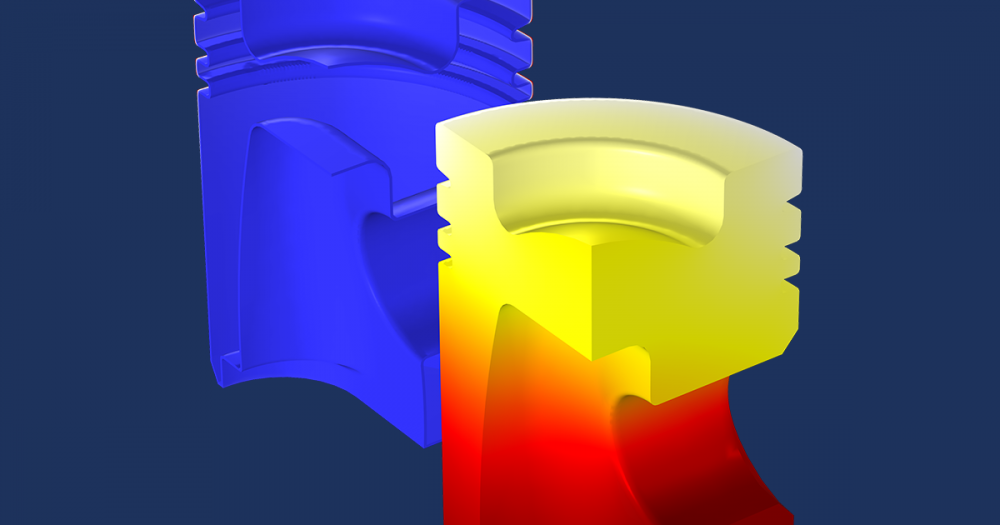
The fatigue usage factor is plotted for cutouts of the initial and optimized designs (left and right, respectively). The shape change is also illustrated with arrows in the middle cutout, where the gray and black lines show the initial and optimized geometry, respectively.
In this example, there is also good correlation between the p-norm objective and the minimum number of cycles to failure, as can be seen in the graph below. It’s worth noting that two of the load cases dominate in terms of the p-norm, but all of the constraints remain active throughout the optimization.

The p-norm objective is plotted together with the maximum fatigue usage factor. The two curves seem to be well correlated. Note that the fatigue usage factor is plotted on a logarithmic axis.
Concluding Remarks
The optimization of fatigue life is not straightforward, but it’s often possible to improve behavior using stress-based shape optimization. The optimization results should be checked with a fatigue analysis. Then, the optimization result can be used as input to the next phase of the workflow.
In this blog post, we have focused on using the p-norm of the von Mises stress as an objective, but because COMSOL Multiphysics® automatically performs the sensitivity analysis needed for gradient-based optimization, it’s easy to experiment with alternative objectives.


Comments (1)
Olivia Ferguson
July 28, 2023Thanks for the information.